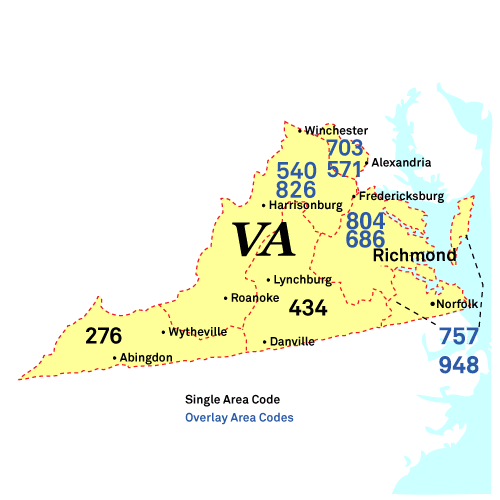
Warsaw Phone Book
Public Schools
Northern Neck Gov Stem Academy/Agric & Maritime Studies
13946 Historyland Highway, Warsaw, VA 22572
Museums
Local Education Agencies
Warsaw Reverse Phone Lookup
Browse Chicago phone numbers by rate center and prefix.
Warsaw Phone Numbers
Rate Center: Warsaw (WARSAW)
Phone numbers with the Warsaw rate center prefixes:
Illinois City Phone Books
- Virginia Beach, VA Phone Book
- Norfolk, VA Phone Book
- Chesapeake, VA Phone Book
- Arlington, VA Phone Book
- Richmond, VA Phone Book
- Newport News, VA Phone Book
- Alexandria, VA Phone Book
- Hampton, VA Phone Book
- Roanoke, VA Phone Book
- Portsmouth, VA Phone Book
- Suffolk, VA Phone Book
- Lynchburg, VA Phone Book
- Centreville, VA Phone Book
- Reston, VA Phone Book
- Leesburg, VA Phone Book
- Harrisonburg, VA Phone Book
- McLean, VA Phone Book
- Charlottesville, VA Phone Book
- Blacksburg, VA Phone Book
- Ashburn, VA Phone Book
- Burke, VA Phone Book
- Woodbridge, VA Phone Book
- Annandale, VA Phone Book
- Manassas, VA Phone Book
- Danville, VA Phone Book
- Mechanicsville, VA Phone Book
- Springfield, VA Phone Book
- Sterling, VA Phone Book
- Petersburg, VA Phone Book
- Fredericksburg, VA Phone Book
- Winchester, VA Phone Book
- Salem, VA Phone Book
- Tysons, VA Phone Book
- Staunton, VA Phone Book
- Herndon, VA Phone Book
- Chantilly, VA Phone Book
- Fairfax, VA Phone Book
- Hopewell, VA Phone Book
- Christiansburg, VA Phone Book
- Waynesboro, VA Phone Book
- Chester, VA Phone Book
- Lorton, VA Phone Book
- Culpeper, VA Phone Book
- Midlothian, VA Phone Book
- Radford, VA Phone Book
- Colonial Heights, VA Phone Book
- Bristol, VA Phone Book
- Vienna, VA Phone Book
- Gainesville, VA Phone Book
- Front Royal, VA Phone Book
- Williamsburg, VA Phone Book
- Glen Allen, VA Phone Book
- Falls Church, VA Phone Book
- Martinsville, VA Phone Book
- Madison Heights, VA Phone Book
- Purcellville, VA Phone Book
- Warrenton, VA Phone Book
- Fishersville, VA Phone Book
- Pulaski, VA Phone Book
- Smithfield, VA Phone Book
- Farmville, VA Phone Book
- Franklin, VA Phone Book
- Abingdon, VA Phone Book
- Wytheville, VA Phone Book
- Ashland, VA Phone Book
- South Boston, VA Phone Book
- Lexington, VA Phone Book
- Sandston, VA Phone Book
- Strasburg, VA Phone Book
- Bedford, VA Phone Book
- Buena Vista, VA Phone Book
- Galax, VA Phone Book
- Covington, VA Phone Book
- Marion, VA Phone Book
- Dumfries, VA Phone Book
- Emporia, VA Phone Book
- Woodstock, VA Phone Book
- Orange, VA Phone Book
- Luray, VA Phone Book
- Stafford, VA Phone Book
- Bluefield, VA Phone Book
- Rocky Mount, VA Phone Book
- King George, VA Phone Book
- South Hill, VA Phone Book
- Berryville, VA Phone Book
- Tazewell, VA Phone Book
- Colonial Beach, VA Phone Book
- Clifton Forge, VA Phone Book
- Lebanon, VA Phone Book
- Wise, VA Phone Book
- Chincoteague, VA Phone Book
- Elkton, VA Phone Book
- Hillsville, VA Phone Book
- Pearisburg, VA Phone Book
- Dublin, VA Phone Book
- Amherst, VA Phone Book
- Warsaw, VA Phone Book
- Saltville, VA Phone Book
- Stephens City, VA Phone Book
- Victoria, VA Phone Book
- Appomattox, VA Phone Book
- Tappahannock, VA Phone Book
- Gate City, VA Phone Book
- Chatham, VA Phone Book
- Courtland, VA Phone Book
- Prince George, VA Phone Book
- Rustburg, VA Phone Book
- Stuart, VA Phone Book
- Clintwood, VA Phone Book
- Lawrenceville, VA Phone Book
- Haymarket, VA Phone Book
- Independence, VA Phone Book
- New Kent, VA Phone Book
- Middleburg, VA Phone Book
- Floyd, VA Phone Book
- Powhatan, VA Phone Book
- Troutville, VA Phone Book
- Madison, VA Phone Book
- King William, VA Phone Book
- Yorktown, VA Phone Book
- New Castle, VA Phone Book
- Aldie, VA Phone Book
- Palmyra, VA Phone Book
- Henrico, VA Phone Book
- Chesterfield, VA Phone Book
- Ruther Glen, VA Phone Book
- Spotsylvania, VA Phone Book
- Gloucester, VA Phone Book
- North Chesterfield, VA Phone Book
- Oak Hill, VA Phone Book
Local Time in Warsaw, VA
Local Time
02:33 PM
Date
Tuesday, April 15, 2025
Time Zone
EDT
Warsaw, VA Population
Chicago has a population of 2368 people. Sex ratio is 126.80 males per 100 females.
Population by Age
The median age in Chicago is 34.8 years.
| Age Groups | Population |
|---|---|
| Under 5 years | 209 |
| 5 to 9 years | 97 |
| 10 to 14 years | 116 |
| 15 to 19 years | 68 |
| 20 to 24 years | 114 |
| 25 to 29 years | 238 |
| 30 to 34 years | 200 |
| 35 to 39 years | 127 |
| 40 to 44 years | 180 |
| 45 to 49 years | 123 |
| 50 to 54 years | 193 |
| 55 to 59 years | 103 |
| 60 to 64 years | 147 |
| 65 to 69 years | 96 |
| 70 to 74 years | 82 |
| 75 to 79 years | 113 |
| 80 to 84 years | 67 |
| 85 years and over | 95 |
Race & Ethnicity
| Racial/Ethnic Groups | Percent |
|---|---|
| White | 1058 |
| Black or African American | 482 |
| American Indian and Alaska Native | 1 |
| Native Hawaiian and Other Pacific Islander | 0 |
| Some Other Race | 24 |
| Two or more races | 62 |
