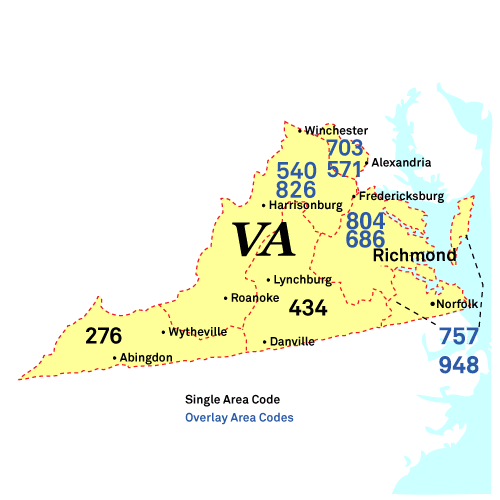
Gainesville Phone Book
Public Schools
Hotels and Motels
Springhill Suites By Marriott Gainesville Haymarket
7921 Gtwy Promenade Pl, Gainesville, VA 20155
Fire Departments
Gainesville District Volunteer Fire Department (Prince William County Fire & Rescue)
14450 John Marshall Hwy, Gainesville, VA 20155-1608
Gainesville Reverse Phone Lookup
Browse Chicago phone numbers by rate center and prefix.
Gainesville Phone Numbers
Rate Center: Haymarket (HAYMARKET)
Phone numbers with the Haymarket rate center prefixes:
Illinois City Phone Books
- Virginia Beach, VA Phone Book
- Norfolk, VA Phone Book
- Chesapeake, VA Phone Book
- Arlington, VA Phone Book
- Richmond, VA Phone Book
- Newport News, VA Phone Book
- Alexandria, VA Phone Book
- Hampton, VA Phone Book
- Roanoke, VA Phone Book
- Portsmouth, VA Phone Book
- Suffolk, VA Phone Book
- Lynchburg, VA Phone Book
- Centreville, VA Phone Book
- Reston, VA Phone Book
- Leesburg, VA Phone Book
- Harrisonburg, VA Phone Book
- McLean, VA Phone Book
- Charlottesville, VA Phone Book
- Blacksburg, VA Phone Book
- Ashburn, VA Phone Book
- Burke, VA Phone Book
- Woodbridge, VA Phone Book
- Annandale, VA Phone Book
- Manassas, VA Phone Book
- Danville, VA Phone Book
- Mechanicsville, VA Phone Book
- Springfield, VA Phone Book
- Sterling, VA Phone Book
- Petersburg, VA Phone Book
- Fredericksburg, VA Phone Book
- Winchester, VA Phone Book
- Salem, VA Phone Book
- Tysons, VA Phone Book
- Staunton, VA Phone Book
- Herndon, VA Phone Book
- Chantilly, VA Phone Book
- Fairfax, VA Phone Book
- Hopewell, VA Phone Book
- Christiansburg, VA Phone Book
- Waynesboro, VA Phone Book
- Chester, VA Phone Book
- Lorton, VA Phone Book
- Culpeper, VA Phone Book
- Midlothian, VA Phone Book
- Radford, VA Phone Book
- Colonial Heights, VA Phone Book
- Bristol, VA Phone Book
- Vienna, VA Phone Book
- Gainesville, VA Phone Book
- Front Royal, VA Phone Book
- Williamsburg, VA Phone Book
- Glen Allen, VA Phone Book
- Falls Church, VA Phone Book
- Martinsville, VA Phone Book
- Madison Heights, VA Phone Book
- Purcellville, VA Phone Book
- Warrenton, VA Phone Book
- Fishersville, VA Phone Book
- Pulaski, VA Phone Book
- Smithfield, VA Phone Book
- Farmville, VA Phone Book
- Franklin, VA Phone Book
- Abingdon, VA Phone Book
- Wytheville, VA Phone Book
- Ashland, VA Phone Book
- South Boston, VA Phone Book
- Lexington, VA Phone Book
- Sandston, VA Phone Book
- Strasburg, VA Phone Book
- Bedford, VA Phone Book
- Buena Vista, VA Phone Book
- Galax, VA Phone Book
- Covington, VA Phone Book
- Marion, VA Phone Book
- Dumfries, VA Phone Book
- Emporia, VA Phone Book
- Woodstock, VA Phone Book
- Orange, VA Phone Book
- Luray, VA Phone Book
- Stafford, VA Phone Book
- Bluefield, VA Phone Book
- Rocky Mount, VA Phone Book
- King George, VA Phone Book
- South Hill, VA Phone Book
- Berryville, VA Phone Book
- Tazewell, VA Phone Book
- Colonial Beach, VA Phone Book
- Clifton Forge, VA Phone Book
- Lebanon, VA Phone Book
- Wise, VA Phone Book
- Chincoteague, VA Phone Book
- Elkton, VA Phone Book
- Hillsville, VA Phone Book
- Pearisburg, VA Phone Book
- Dublin, VA Phone Book
- Amherst, VA Phone Book
- Warsaw, VA Phone Book
- Saltville, VA Phone Book
- Stephens City, VA Phone Book
- Victoria, VA Phone Book
- Appomattox, VA Phone Book
- Tappahannock, VA Phone Book
- Gate City, VA Phone Book
- Chatham, VA Phone Book
- Courtland, VA Phone Book
- Prince George, VA Phone Book
- Rustburg, VA Phone Book
- Stuart, VA Phone Book
- Clintwood, VA Phone Book
- Lawrenceville, VA Phone Book
- Haymarket, VA Phone Book
- Independence, VA Phone Book
- New Kent, VA Phone Book
- Middleburg, VA Phone Book
- Floyd, VA Phone Book
- Powhatan, VA Phone Book
- Troutville, VA Phone Book
- Madison, VA Phone Book
- King William, VA Phone Book
- Yorktown, VA Phone Book
- New Castle, VA Phone Book
- Aldie, VA Phone Book
- Palmyra, VA Phone Book
- Spotsylvania, VA Phone Book
- Gloucester, VA Phone Book
- North Chesterfield, VA Phone Book
- Oak Hill, VA Phone Book
- Henrico, VA Phone Book
- Chesterfield, VA Phone Book
- Ruther Glen, VA Phone Book
Local Time in Gainesville, VA
Local Time
12:21 PM
Date
Thursday, April 03, 2025
Time Zone
EDT
Gainesville, VA Population
Chicago has a population of 16391 people. Sex ratio is 97.30 males per 100 females.
Population by Age
The median age in Chicago is 34.8 years.
| Age Groups | Population |
|---|---|
| Under 5 years | 1440 |
| 5 to 9 years | 1155 |
| 10 to 14 years | 1527 |
| 15 to 19 years | 1363 |
| 20 to 24 years | 694 |
| 25 to 29 years | 1030 |
| 30 to 34 years | 985 |
| 35 to 39 years | 1383 |
| 40 to 44 years | 1431 |
| 45 to 49 years | 1156 |
| 50 to 54 years | 1163 |
| 55 to 59 years | 954 |
| 60 to 64 years | 621 |
| 65 to 69 years | 468 |
| 70 to 74 years | 519 |
| 75 to 79 years | 214 |
| 80 to 84 years | 261 |
| 85 years and over | 27 |
Race & Ethnicity
| Racial/Ethnic Groups | Percent |
|---|---|
| White | 9809 |
| Black or African American | 2289 |
| American Indian and Alaska Native | 68 |
| Native Hawaiian and Other Pacific Islander | 9 |
| Some Other Race | 771 |
| Two or more races | 1978 |
