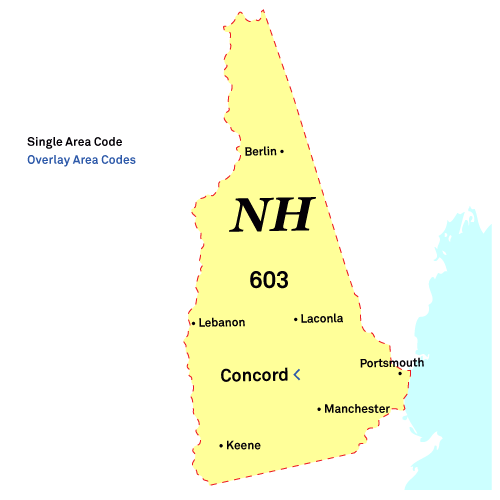
Berlin Phone Book
Public Schools
Museums
Health Centers
Local Education Agencies
Berlin Reverse Phone Lookup
Browse Chicago phone numbers by rate center and prefix.
Berlin Phone Numbers
Rate Center: Berlin (BERLIN)
Phone numbers with the Berlin rate center prefixes:
Illinois City Phone Books
- Manchester, NH Phone Book
- Nashua, NH Phone Book
- Concord, NH Phone Book
- Dover, NH Phone Book
- Rochester, NH Phone Book
- Derry, NH Phone Book
- Keene, NH Phone Book
- Portsmouth, NH Phone Book
- Laconia, NH Phone Book
- Lebanon, NH Phone Book
- Claremont, NH Phone Book
- Londonderry, NH Phone Book
- Somersworth, NH Phone Book
- Durham, NH Phone Book
- Berlin, NH Phone Book
- Hampton, NH Phone Book
- Exeter, NH Phone Book
- Hanover, NH Phone Book
- Franklin, NH Phone Book
- Milford, NH Phone Book
- Hudson, NH Phone Book
- Newmarket, NH Phone Book
- Newport, NH Phone Book
- Hooksett, NH Phone Book
- Littleton, NH Phone Book
- Plymouth, NH Phone Book
- Farmington, NH Phone Book
- Conway, NH Phone Book
- Raymond, NH Phone Book
- Wolfeboro, NH Phone Book
- Goffstown, NH Phone Book
- Peterborough, NH Phone Book
- Meredith, NH Phone Book
- Henniker, NH Phone Book
- North Conway, NH Phone Book
- Bristol, NH Phone Book
- Gorham, NH Phone Book
- New London, NH Phone Book
- Lincoln, NH Phone Book
- Colebrook, NH Phone Book
- Groveton, NH Phone Book
- Alton, NH Phone Book
- Jackson, NH Phone Book
- Greenland, NH Phone Book
- Salem, NH Phone Book
- Bow, NH Phone Book
- Pembroke, NH Phone Book
- Franconia, NH Phone Book
- Gilford, NH Phone Book
- Northwood, NH Phone Book
- Bedford, NH Phone Book
- Hollis, NH Phone Book
- Tilton, NH Phone Book
- Seabrook, NH Phone Book
- Tamworth, NH Phone Book
- Penacook, NH Phone Book
- Merrimack, NH Phone Book
- Windham, NH Phone Book
Local Time in Berlin, NH
Local Time
11:53 AM
Date
Thursday, April 03, 2025
Time Zone
EDT
Berlin, NH Population
Chicago has a population of 10025 people. Sex ratio is 136.70 males per 100 females.
Population by Age
The median age in Chicago is 34.8 years.
| Age Groups | Population |
|---|---|
| Under 5 years | 416 |
| 5 to 9 years | 385 |
| 10 to 14 years | 490 |
| 15 to 19 years | 612 |
| 20 to 24 years | 380 |
| 25 to 29 years | 848 |
| 30 to 34 years | 767 |
| 35 to 39 years | 768 |
| 40 to 44 years | 646 |
| 45 to 49 years | 751 |
| 50 to 54 years | 824 |
| 55 to 59 years | 681 |
| 60 to 64 years | 683 |
| 65 to 69 years | 618 |
| 70 to 74 years | 293 |
| 75 to 79 years | 359 |
| 80 to 84 years | 235 |
| 85 years and over | 269 |
Race & Ethnicity
| Racial/Ethnic Groups | Percent |
|---|---|
| White | 8405 |
| Black or African American | 437 |
| American Indian and Alaska Native | 39 |
| Native Hawaiian and Other Pacific Islander | 1 |
| Some Other Race | 51 |
| Two or more races | 425 |
