Reverse Phone Number Lookup in New Hampshire
Reverse phone lookup in New Hampshire provides residents with the name and address registered to any phone number through public government databases. This number search is a simple and effective way to screen calls and stay safe. Use this reverse search to verify caller identities, avoid scammers, and determine whether unfamiliar numbers belong to legitimate sources.
Reverse Phone Lookup by New Hampshire Area Code
All New Hampshire phone numbers consist of three parts: the three-digit Area Code,
the three-digit Prefix Code (also known as the exchange or central office code),
and the final four-digit line number. While the area code narrows down the
location to a large region, the prefix code can often specify the original city
or town where the number was registered.

Here's a complete list of New Hampshire area codes:
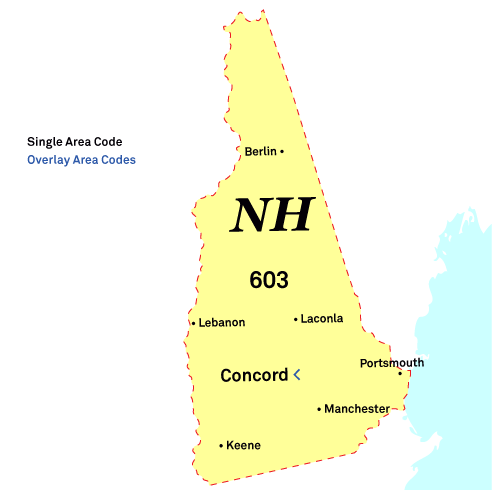
Area Code 603: Manchester, Nashua, Concord
Location: The 603 area code covers the entire state of New Hampshire, including major cities like Manchester, Nashua, and Concord.
Common Callers: Dartmouth-Hitchcock Health schedulers, Fidelity Investments support, and BAE Systems recruiters.
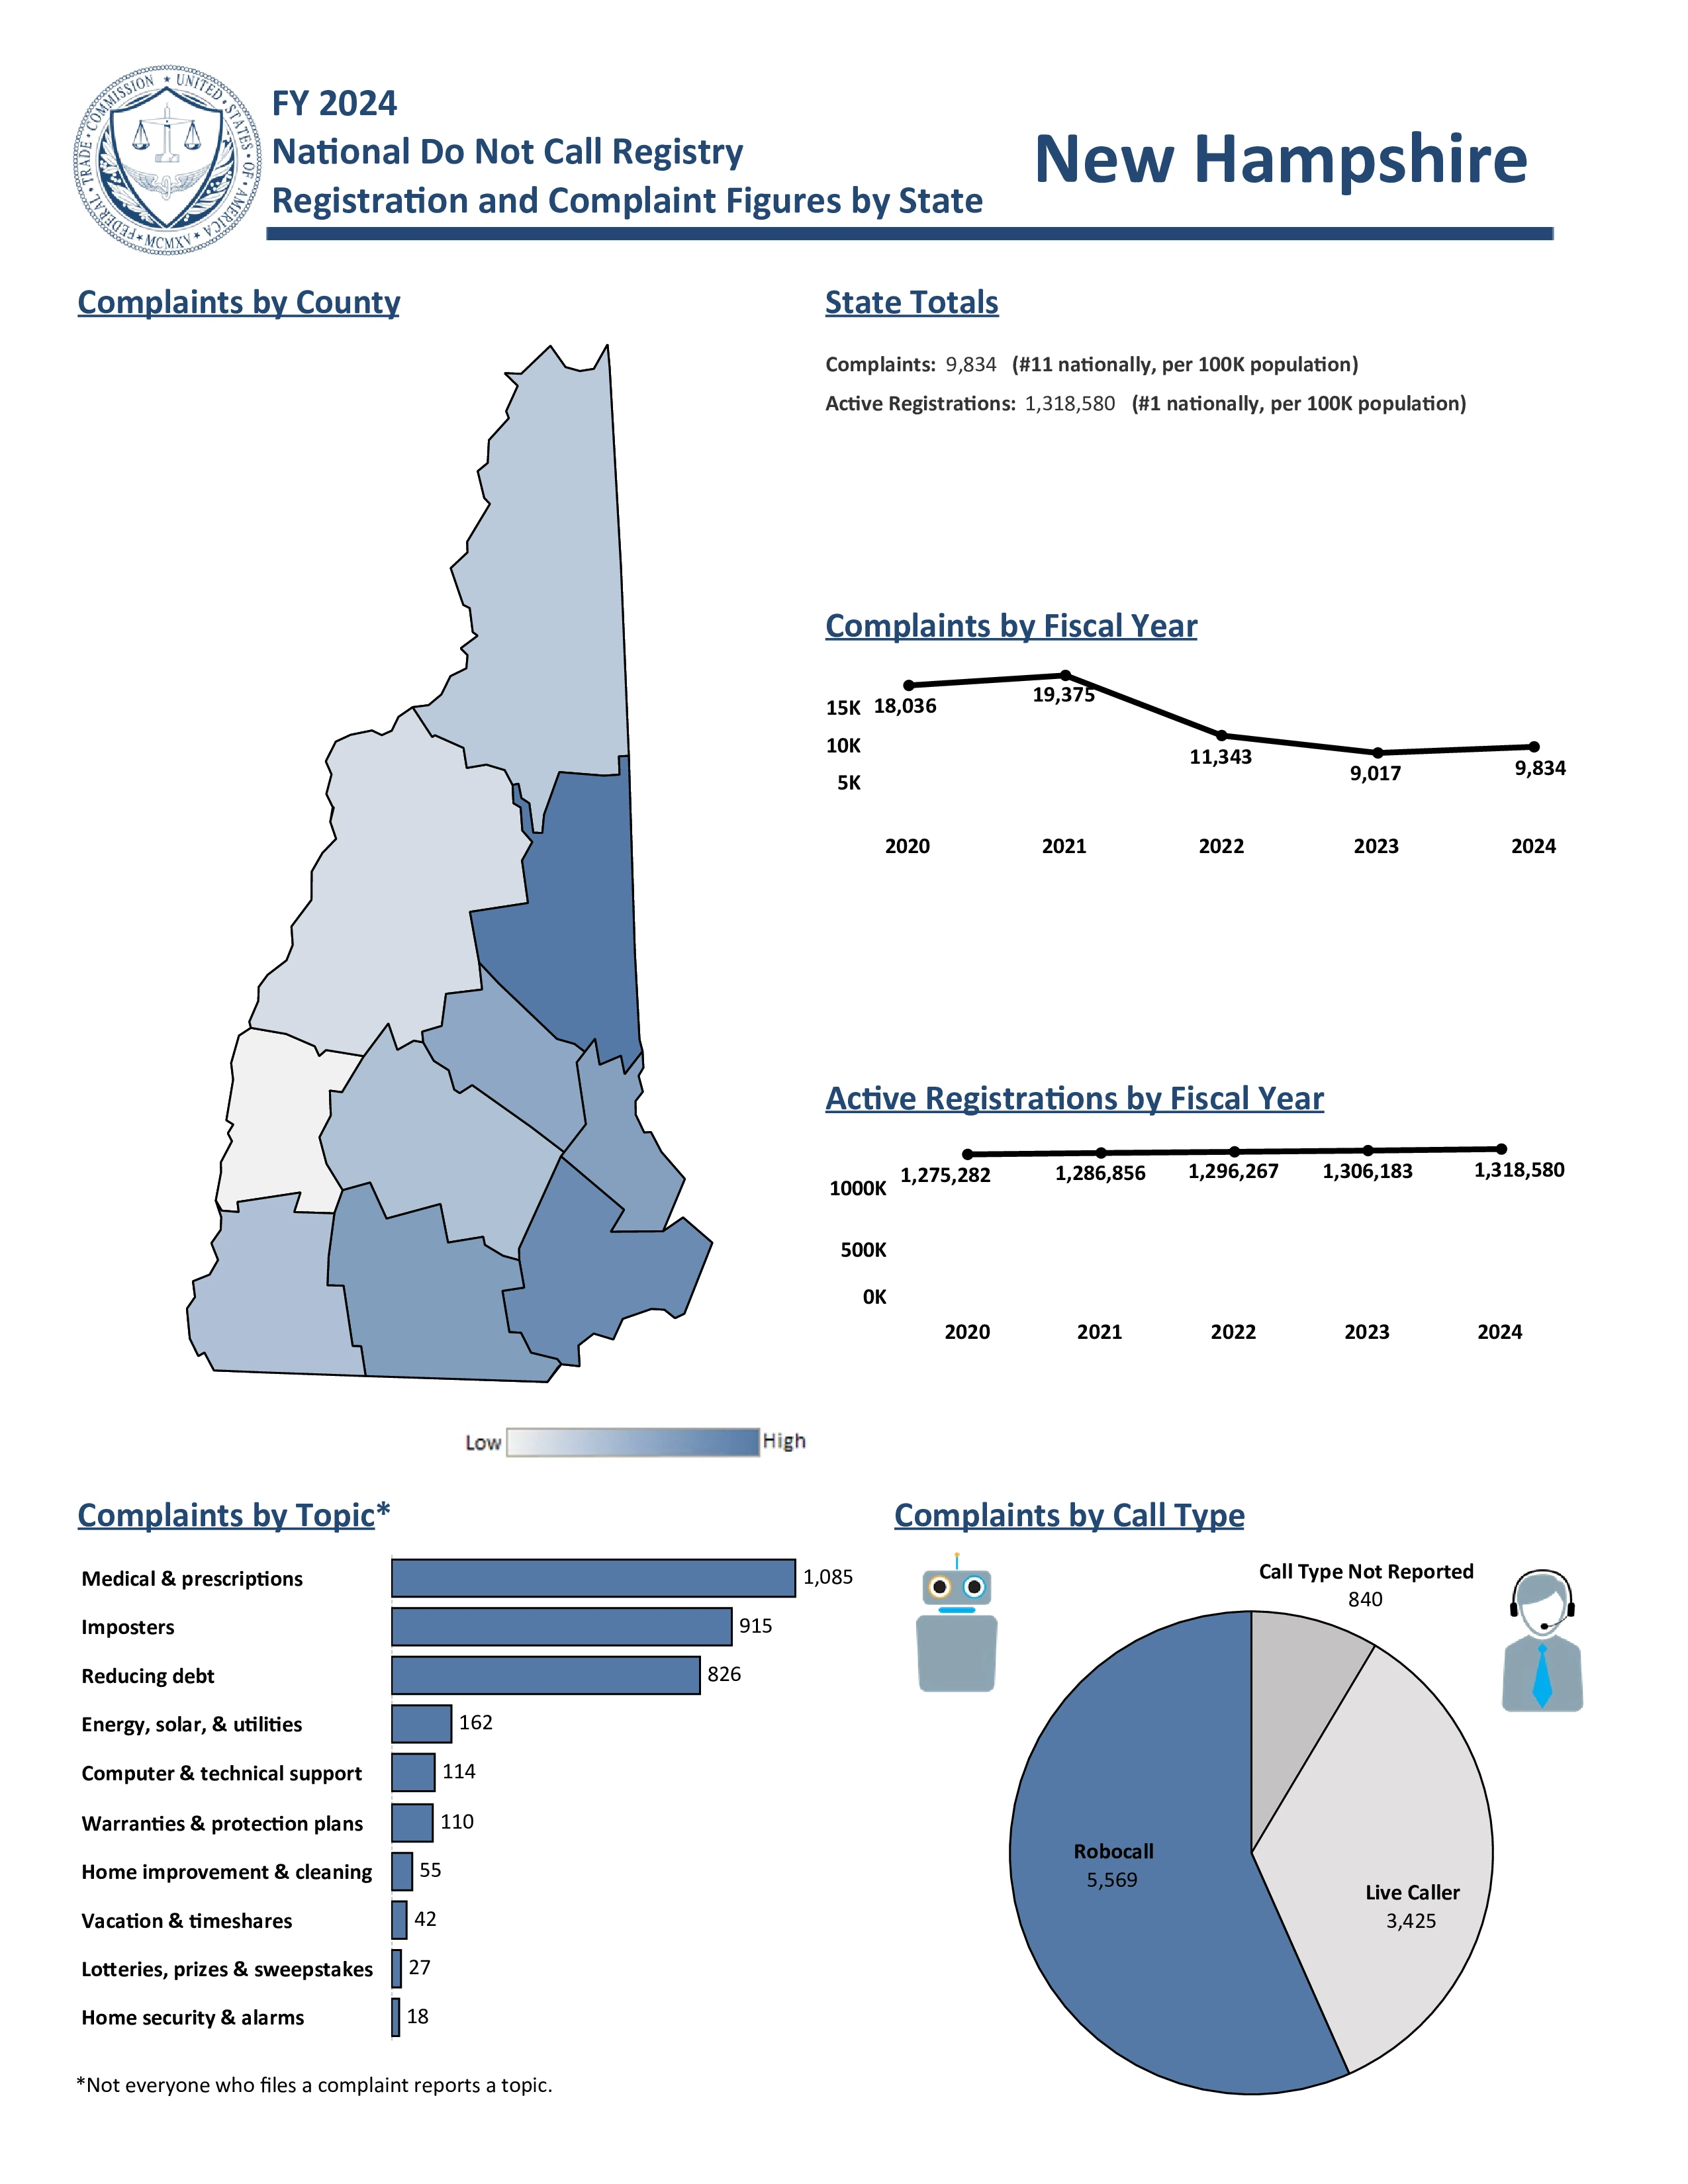
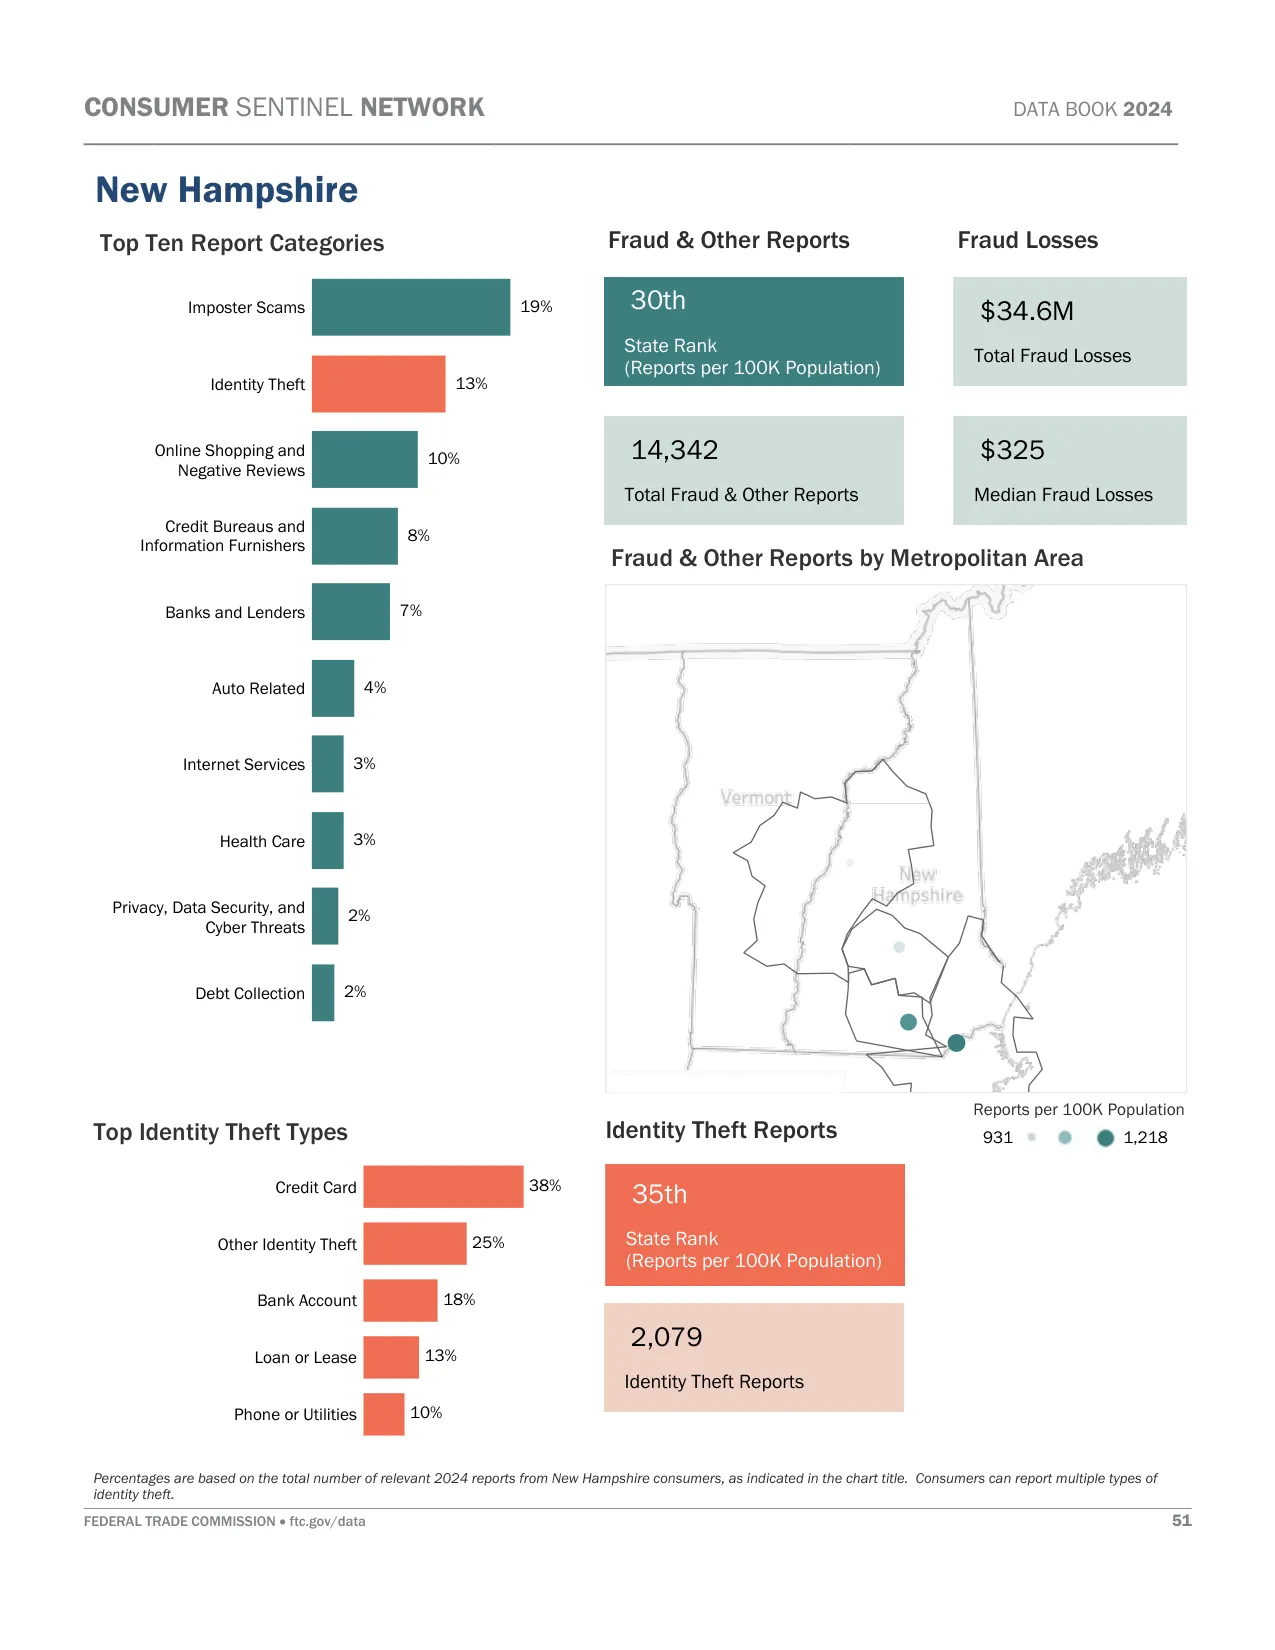
Scams and Spam Calls: The 603 area code is targeted by the "Howard, Clark & Associates" Legal Threat scam and Fake NH Police & Firefighter Donation scams. Aggressive Auto Warranty Renewal calls are frequent, along with Fake Apple & Amazon Support scams and "Can You Hear Me?" voice phishing.
Important: Area codes show where a number was originally assigned, not where the caller currently lives. Federal number portability laws
allow people to keep their phone numbers when moving or switching carriers. Use our reverse phone lookup tool above to get detailed phone number owner information.
For latest New Hampshire phone numbering regulations, contact Amanda Noonan at the New Hampshire PSC via [email protected] or 603-271-1164.
New Hampshire Phone Numbers
New Hampshire has approximately 2 million active phone numbers. Mobile phones dominate with 1.5 million users, while traditional landlines are declining with just 120,000 connections statewide. Internet phone services account for about 366,000 numbers.
This indicates that tracing a New Hampshire phone number will likely lead to a cell phone. The continued decline of landlines means that newer phone numbers may be more challenging to trace compared to older landline numbers, which historically had more readily available public information.
New Hampshire Voice Subscriptions (in thousands):
| Service Type |
June 2023 |
Dec 2023 |
June 2024 |
| Mobile telephony |
1,494 |
1,521 |
1,538 |
| Local exchange telephone service |
130 |
123 |
120 |
| VoIP subscriptions |
369 |
361 |
366 |
| Total |
1,993 |
2,005 |
2,024 |
Source: FCC Voice Telephone Services Report
Top 5 US Cell Phone Companies
Most phone numbers are cell phones, and most cell phone numbers come from the top three United States wireless companies. Here are the top five US Cell Phone Companies in Q1 2025:
- Verizon - 146 million customers
- T-Mobile US - 131 million customers
- AT&T Mobility - 118 million customers
- Boost Mobile - 7 million customers
- U.S. Cellular - 4.4 million customers


