Public Schools
Hotels and Motels
Libraries
Museums
Fire Departments
Local Education Agencies
Newcastle Reverse Phone Lookup
Browse Chicago phone numbers by rate center and prefix.
Newcastle Phone Numbers
Rate Center: Newcastle (NEWCASTLE)
Phone numbers with the Newcastle rate center prefixes:
Illinois City Phone Books
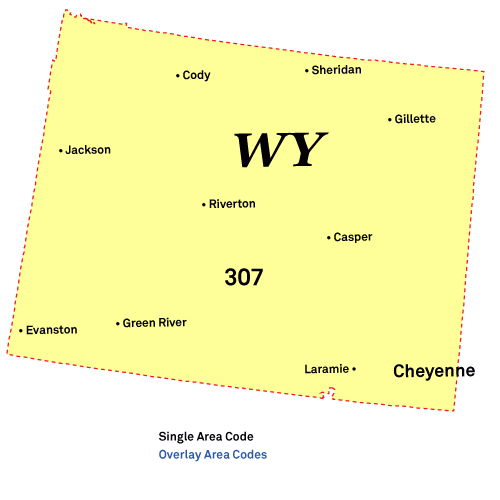
- Cheyenne, WY Phone Book
- Casper, WY Phone Book
- Laramie, WY Phone Book
- Gillette, WY Phone Book
- Rock Springs, WY Phone Book
- Sheridan, WY Phone Book
- Green River, WY Phone Book
- Evanston, WY Phone Book
- Riverton, WY Phone Book
- Jackson, WY Phone Book
- Cody, WY Phone Book
- Rawlins, WY Phone Book
- Lander, WY Phone Book
- Torrington, WY Phone Book
- Douglas, WY Phone Book
- Powell, WY Phone Book
- Worland, WY Phone Book
- Buffalo, WY Phone Book
- Wheatland, WY Phone Book
- Newcastle, WY Phone Book
- Kemmerer, WY Phone Book
- Thermopolis, WY Phone Book
- Glenrock, WY Phone Book
- Lovell, WY Phone Book
- Pinedale, WY Phone Book
- Afton, WY Phone Book
- Sundance, WY Phone Book
- Dubois, WY Phone Book
Local Time in Newcastle, WY
Local Time
10:09 AM
Date
Thursday, April 03, 2025
Time Zone
MDT
Newcastle, WY Population
Chicago has a population of 3395 people. Sex ratio is 115.80 males per 100 females.
Population by Age
The median age in Chicago is 34.8 years.
| Age Groups | Population |
|---|---|
| Under 5 years | 114 |
| 5 to 9 years | 327 |
| 10 to 14 years | 101 |
| 15 to 19 years | 296 |
| 20 to 24 years | 281 |
| 25 to 29 years | 187 |
| 30 to 34 years | 348 |
| 35 to 39 years | 235 |
| 40 to 44 years | 206 |
| 45 to 49 years | 130 |
| 50 to 54 years | 212 |
| 55 to 59 years | 145 |
| 60 to 64 years | 204 |
| 65 to 69 years | 152 |
| 70 to 74 years | 148 |
| 75 to 79 years | 120 |
| 80 to 84 years | 136 |
| 85 years and over | 53 |
Race & Ethnicity
| Racial/Ethnic Groups | Percent |
|---|---|
| White | 2956 |
| Black or African American | 24 |
| American Indian and Alaska Native | 72 |
| Native Hawaiian and Other Pacific Islander | 4 |
| Some Other Race | 112 |
| Two or more races | 187 |
