Bountiful Phone Book
Public Schools
Hospitals
Libraries
Museums
Alternative Fuel Stations
Bountiful Reverse Phone Lookup
Browse Chicago phone numbers by rate center and prefix.
Bountiful Phone Numbers
Rate Center: Bountiful (BOUNTIFUL)
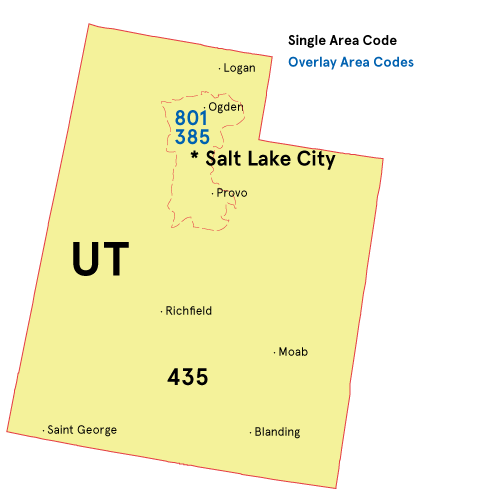
Phone numbers with the Bountiful rate center prefixes:
- Phone Numbers 385-243-....
- Phone Numbers 385-399-....
- Phone Numbers 801-203-....
- Phone Numbers 801-292-....
- Phone Numbers 801-294-....
- Phone Numbers 801-295-....
- Phone Numbers 801-296-....
- Phone Numbers 801-298-....
- Phone Numbers 801-299-....
- Phone Numbers 801-335-....
- Phone Numbers 801-383-....
- Phone Numbers 801-397-....
- Phone Numbers 801-677-....
- Phone Numbers 801-683-....
- Phone Numbers 801-693-....
- Phone Numbers 801-797-....
- Phone Numbers 801-813-....
- Phone Numbers 801-872-....
- Phone Numbers 801-936-....
- Phone Numbers 801-951-....
- Phone Numbers 801-992-....
Illinois City Phone Books
- Salt Lake City, UT Phone Book
- West Valley City, UT Phone Book
- Provo, UT Phone Book
- West Jordan, UT Phone Book
- Orem, UT Phone Book
- Sandy, UT Phone Book
- St. George, UT Phone Book
- Ogden, UT Phone Book
- Layton, UT Phone Book
- South Jordan, UT Phone Book
- Lehi, UT Phone Book
- Taylorsville, UT Phone Book
- Logan, UT Phone Book
- Murray, UT Phone Book
- Draper, UT Phone Book
- Herriman, UT Phone Book
- Bountiful, UT Phone Book
- Riverton, UT Phone Book
- Spanish Fork, UT Phone Book
- Roy, UT Phone Book
- Pleasant Grove, UT Phone Book
- Eagle Mountain, UT Phone Book
- Tooele, UT Phone Book
- Midvale, UT Phone Book
- Cedar City, UT Phone Book
- Springville, UT Phone Book
- Kaysville, UT Phone Book
- American Fork, UT Phone Book
- Clearfield, UT Phone Book
- Saratoga Springs, UT Phone Book
- Syracuse, UT Phone Book
- Washington, UT Phone Book
- South Salt Lake, UT Phone Book
- Farmington, UT Phone Book
- Clinton, UT Phone Book
- Payson, UT Phone Book
- Brigham City, UT Phone Book
- Hurricane, UT Phone Book
- Grantsville, UT Phone Book
- Woods Cross, UT Phone Book
- North Logan, UT Phone Book
- Vernal, UT Phone Book
- Tremonton, UT Phone Book
- Park City, UT Phone Book
- Price, UT Phone Book
- Richfield, UT Phone Book
- Roosevelt, UT Phone Book
- Nephi, UT Phone Book
- Moab, UT Phone Book
- Kanab, UT Phone Book
- La Verkin, UT Phone Book
- Morgan, UT Phone Book
- Delta, UT Phone Book
- Blanding, UT Phone Book
- Beaver, UT Phone Book
- Salina, UT Phone Book
- Fillmore, UT Phone Book
- Monticello, UT Phone Book
- Coalville, UT Phone Book
- Panguitch, UT Phone Book
- Green River, UT Phone Book
- Springdale, UT Phone Book
- Bicknell, UT Phone Book
- Kearns, UT Phone Book
- Magna, UT Phone Book
- Heber City, UT Phone Book
Local Time in Bountiful, UT
Local Time
10:12 AM
Date
Thursday, April 03, 2025
Time Zone
MDT
Bountiful, UT Population
Chicago has a population of 43991 people. Sex ratio is 99.30 males per 100 females.
Population by Age
The median age in Chicago is 34.8 years.
| Age Groups | Population |
|---|---|
| Under 5 years | 3898 |
| 5 to 9 years | 3806 |
| 10 to 14 years | 3375 |
| 15 to 19 years | 2730 |
| 20 to 24 years | 2539 |
| 25 to 29 years | 3781 |
| 30 to 34 years | 3934 |
| 35 to 39 years | 2794 |
| 40 to 44 years | 2731 |
| 45 to 49 years | 1796 |
| 50 to 54 years | 1934 |
| 55 to 59 years | 2293 |
| 60 to 64 years | 2000 |
| 65 to 69 years | 1730 |
| 70 to 74 years | 1440 |
| 75 to 79 years | 1067 |
| 80 to 84 years | 1014 |
| 85 years and over | 1129 |
Race & Ethnicity
| Racial/Ethnic Groups | Percent |
|---|---|
| White | 39557 |
| Black or African American | 361 |
| American Indian and Alaska Native | 229 |
| Native Hawaiian and Other Pacific Islander | 563 |
| Some Other Race | 1264 |
| Two or more races | 3060 |
