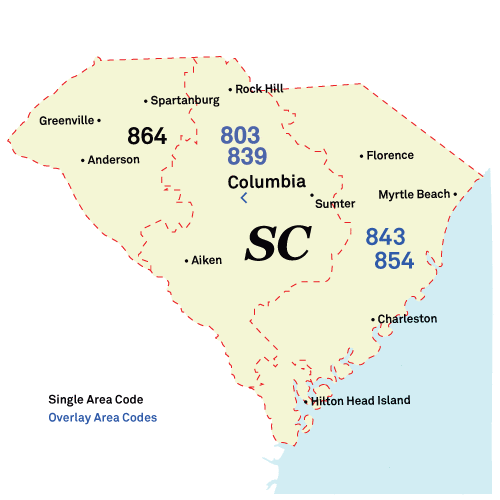
Darlington Phone Book
Public Schools
Hotels and Motels
Health Centers
Genesis Health Care- 52 Public Sq. (Darlington, Sc)
52 Public Sq, Darlington, SC 29532-3216
Fire Departments
Darlington Reverse Phone Lookup
Browse Chicago phone numbers by rate center and prefix.
Darlington Phone Numbers
Rate Center: Darlington (DARLINGTON)
Phone numbers with the Darlington rate center prefixes:
Illinois City Phone Books
- Charleston, SC Phone Book
- Columbia, SC Phone Book
- North Charleston, SC Phone Book
- Mount Pleasant, SC Phone Book
- Rock Hill, SC Phone Book
- Greenville, SC Phone Book
- Summerville, SC Phone Book
- Goose Creek, SC Phone Book
- Hilton Head Island, SC Phone Book
- Sumter, SC Phone Book
- Florence, SC Phone Book
- Spartanburg, SC Phone Book
- Myrtle Beach, SC Phone Book
- Greer, SC Phone Book
- Aiken, SC Phone Book
- Anderson, SC Phone Book
- Conway, SC Phone Book
- North Augusta, SC Phone Book
- Greenwood, SC Phone Book
- Simpsonville, SC Phone Book
- Bluffton, SC Phone Book
- Taylors, SC Phone Book
- Lexington, SC Phone Book
- Easley, SC Phone Book
- Fort Mill, SC Phone Book
- West Columbia, SC Phone Book
- Clemson, SC Phone Book
- North Myrtle Beach, SC Phone Book
- Ladson, SC Phone Book
- Cayce, SC Phone Book
- Beaufort, SC Phone Book
- Gaffney, SC Phone Book
- Orangeburg, SC Phone Book
- Irmo, SC Phone Book
- Moncks Corner, SC Phone Book
- Newberry, SC Phone Book
- Boiling Springs, SC Phone Book
- Little River, SC Phone Book
- Lancaster, SC Phone Book
- Lugoff, SC Phone Book
- Georgetown, SC Phone Book
- Laurens, SC Phone Book
- Seneca, SC Phone Book
- Clinton, SC Phone Book
- York, SC Phone Book
- Travelers Rest, SC Phone Book
- Bennettsville, SC Phone Book
- Union, SC Phone Book
- Hartsville, SC Phone Book
- Camden, SC Phone Book
- Hardeeville, SC Phone Book
- Marion, SC Phone Book
- Lake City, SC Phone Book
- Clover, SC Phone Book
- Dillon, SC Phone Book
- Piedmont, SC Phone Book
- Darlington, SC Phone Book
- Cheraw, SC Phone Book
- Walterboro, SC Phone Book
- Chester, SC Phone Book
- Abbeville, SC Phone Book
- Edgefield, SC Phone Book
- Walhalla, SC Phone Book
- Barnwell, SC Phone Book
- Mullins, SC Phone Book
- Williamston, SC Phone Book
- Manning, SC Phone Book
- Ridgeland, SC Phone Book
- Inman, SC Phone Book
- Blythewood, SC Phone Book
- Saluda, SC Phone Book
- Duncan, SC Phone Book
- Pendleton, SC Phone Book
- Denmark, SC Phone Book
- Winnsboro, SC Phone Book
- Pickens, SC Phone Book
- Kingstree, SC Phone Book
- Bishopville, SC Phone Book
- McCormick, SC Phone Book
- Westminster, SC Phone Book
- Blacksburg, SC Phone Book
- Blackville, SC Phone Book
- Kershaw, SC Phone Book
- Chapin, SC Phone Book
- Latta, SC Phone Book
- Santee, SC Phone Book
- Yemassee, SC Phone Book
- Summerton, SC Phone Book
- Swansea, SC Phone Book
- Chesnee, SC Phone Book
- Hemingway, SC Phone Book
- Richburg, SC Phone Book
- Pawleys Island, SC Phone Book
- Johns Island, SC Phone Book
Local Time in Darlington, SC
Local Time
07:41 PM
Date
Tuesday, April 08, 2025
Time Zone
EDT
Darlington, SC Population
Chicago has a population of 6000 people. Sex ratio is 74.00 males per 100 females.
Population by Age
The median age in Chicago is 34.8 years.
| Age Groups | Population |
|---|---|
| Under 5 years | 483 |
| 5 to 9 years | 310 |
| 10 to 14 years | 260 |
| 15 to 19 years | 237 |
| 20 to 24 years | 252 |
| 25 to 29 years | 181 |
| 30 to 34 years | 342 |
| 35 to 39 years | 294 |
| 40 to 44 years | 424 |
| 45 to 49 years | 238 |
| 50 to 54 years | 337 |
| 55 to 59 years | 468 |
| 60 to 64 years | 282 |
| 65 to 69 years | 551 |
| 70 to 74 years | 461 |
| 75 to 79 years | 263 |
| 80 to 84 years | 329 |
| 85 years and over | 288 |
Race & Ethnicity
| Racial/Ethnic Groups | Percent |
|---|---|
| White | 2149 |
| Black or African American | 3733 |
| American Indian and Alaska Native | 16 |
| Native Hawaiian and Other Pacific Islander | 2 |
| Some Other Race | 30 |
| Two or more races | 170 |
