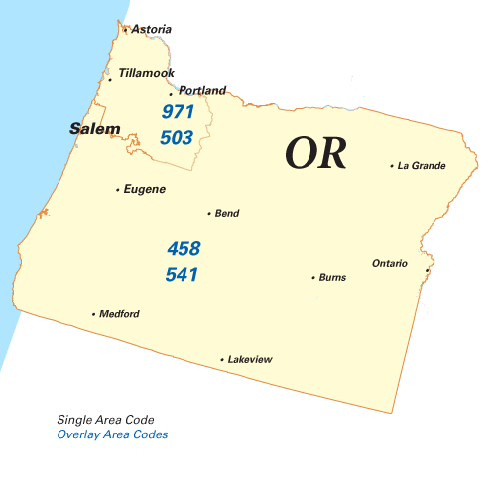
Port Orford Phone Book
Public Schools
Libraries
Museums
Alternative Fuel Stations
Wildspring Guest Habitat - Tesla Destination
92978 Cemetary Loop Rd, Port Orford, OR 97465
Health Centers
Port Orford Reverse Phone Lookup
Browse Chicago phone numbers by rate center and prefix.
Port Orford Phone Numbers
Rate Center: Port Orford (PORTORFORD)
Phone numbers with the Port Orford rate center prefixes:
Illinois City Phone Books
- Portland, OR Phone Book
- Salem, OR Phone Book
- Eugene, OR Phone Book
- Gresham, OR Phone Book
- Hillsboro, OR Phone Book
- Beaverton, OR Phone Book
- Bend, OR Phone Book
- Medford, OR Phone Book
- Springfield, OR Phone Book
- Corvallis, OR Phone Book
- Albany, OR Phone Book
- Tigard, OR Phone Book
- Lake Oswego, OR Phone Book
- Keizer, OR Phone Book
- Grants Pass, OR Phone Book
- Oregon City, OR Phone Book
- McMinnville, OR Phone Book
- Redmond, OR Phone Book
- Tualatin, OR Phone Book
- West Linn, OR Phone Book
- Woodburn, OR Phone Book
- Forest Grove, OR Phone Book
- Wilsonville, OR Phone Book
- Newberg, OR Phone Book
- Roseburg, OR Phone Book
- Happy Valley, OR Phone Book
- Klamath Falls, OR Phone Book
- Ashland, OR Phone Book
- Milwaukie, OR Phone Book
- Sherwood, OR Phone Book
- Central Point, OR Phone Book
- Canby, OR Phone Book
- Hermiston, OR Phone Book
- Lebanon, OR Phone Book
- Pendleton, OR Phone Book
- Dallas, OR Phone Book
- Troutdale, OR Phone Book
- Coos Bay, OR Phone Book
- The Dalles, OR Phone Book
- La Grande, OR Phone Book
- Cornelius, OR Phone Book
- Gladstone, OR Phone Book
- Sandy, OR Phone Book
- Ontario, OR Phone Book
- Newport, OR Phone Book
- Prineville, OR Phone Book
- Silverton, OR Phone Book
- Cottage Grove, OR Phone Book
- Independence, OR Phone Book
- Astoria, OR Phone Book
- Baker City, OR Phone Book
- Sweet Home, OR Phone Book
- North Bend, OR Phone Book
- White City, OR Phone Book
- Eagle Point, OR Phone Book
- Molalla, OR Phone Book
- Florence, OR Phone Book
- Lincoln City, OR Phone Book
- Stayton, OR Phone Book
- Sutherlin, OR Phone Book
- Hood River, OR Phone Book
- Scappoose, OR Phone Book
- Madras, OR Phone Book
- Seaside, OR Phone Book
- Talent, OR Phone Book
- Brookings, OR Phone Book
- Junction City, OR Phone Book
- Warrenton, OR Phone Book
- Creswell, OR Phone Book
- Winston, OR Phone Book
- Tillamook, OR Phone Book
- Philomath, OR Phone Book
- Phoenix, OR Phone Book
- Reedsport, OR Phone Book
- Coquille, OR Phone Book
- Estacada, OR Phone Book
- Toledo, OR Phone Book
- Boardman, OR Phone Book
- Myrtle Creek, OR Phone Book
- Oakridge, OR Phone Book
- Bandon, OR Phone Book
- Burns, OR Phone Book
- Dayton, OR Phone Book
- Sisters, OR Phone Book
- Lakeview, OR Phone Book
- Willamina, OR Phone Book
- Gold Beach, OR Phone Book
- Vale, OR Phone Book
- Clatskanie, OR Phone Book
- Enterprise, OR Phone Book
- Cave Junction, OR Phone Book
- Waldport, OR Phone Book
- Mill City, OR Phone Book
- John Day, OR Phone Book
- Amity, OR Phone Book
- Cannon Beach, OR Phone Book
- Oakland, OR Phone Book
- Scio, OR Phone Book
- Port Orford, OR Phone Book
- Clackamas, OR Phone Book
Local Time in Port Orford, OR
Local Time
01:20 AM
Date
Monday, April 28, 2025
Time Zone
PDT
Port Orford, OR Population
Chicago has a population of 824 people. Sex ratio is 105.50 males per 100 females.
Population by Age
The median age in Chicago is 34.8 years.
| Age Groups | Population |
|---|---|
| Under 5 years | 3 |
| 5 to 9 years | 16 |
| 10 to 14 years | 0 |
| 15 to 19 years | 11 |
| 20 to 24 years | 45 |
| 25 to 29 years | 14 |
| 30 to 34 years | 5 |
| 35 to 39 years | 7 |
| 40 to 44 years | 33 |
| 45 to 49 years | 40 |
| 50 to 54 years | 73 |
| 55 to 59 years | 89 |
| 60 to 64 years | 109 |
| 65 to 69 years | 134 |
| 70 to 74 years | 87 |
| 75 to 79 years | 61 |
| 80 to 84 years | 55 |
| 85 years and over | 42 |
Race & Ethnicity
| Racial/Ethnic Groups | Percent |
|---|---|
| White | 1011 |
| Black or African American | 5 |
| American Indian and Alaska Native | 21 |
| Native Hawaiian and Other Pacific Islander | 4 |
| Some Other Race | 12 |
| Two or more races | 85 |
