Yellow Springs Phone Book
Public Schools
Museums
Alternative Fuel Stations
Local Education Agencies
Yellow Springs Reverse Phone Lookup
Browse Chicago phone numbers by rate center and prefix.
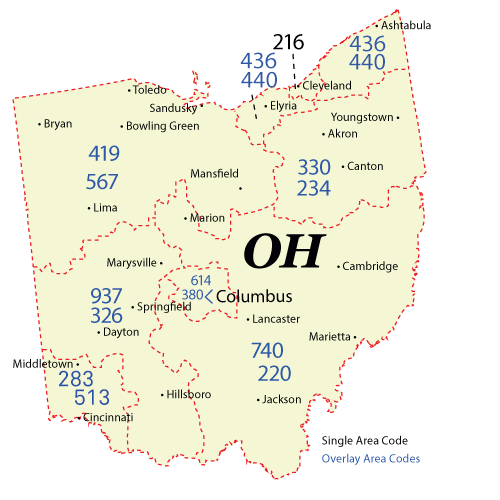
Yellow Springs Phone Numbers
Rate Center: Yellow Springs Clifton (YLSPGCLFTN)
Phone numbers with the Yellow Springs Clifton rate center prefixes:
Illinois City Phone Books
- Columbus, OH Phone Book
- Cleveland, OH Phone Book
- Cincinnati, OH Phone Book
- Toledo, OH Phone Book
- Akron, OH Phone Book
- Dayton, OH Phone Book
- Parma, OH Phone Book
- Canton, OH Phone Book
- Youngstown, OH Phone Book
- Lorain, OH Phone Book
- Hamilton, OH Phone Book
- Springfield, OH Phone Book
- Kettering, OH Phone Book
- Elyria, OH Phone Book
- Lakewood, OH Phone Book
- Newark, OH Phone Book
- Cuyahoga Falls, OH Phone Book
- Middletown, OH Phone Book
- Dublin, OH Phone Book
- Beavercreek, OH Phone Book
- Mentor, OH Phone Book
- Euclid, OH Phone Book
- Mansfield, OH Phone Book
- Strongsville, OH Phone Book
- Cleveland Heights, OH Phone Book
- Fairfield, OH Phone Book
- Delaware, OH Phone Book
- Grove City, OH Phone Book
- Findlay, OH Phone Book
- Huber Heights, OH Phone Book
- Westerville, OH Phone Book
- Lancaster, OH Phone Book
- Warren, OH Phone Book
- Reynoldsburg, OH Phone Book
- Hilliard, OH Phone Book
- Lima, OH Phone Book
- Marion, OH Phone Book
- Gahanna, OH Phone Book
- Upper Arlington, OH Phone Book
- Brunswick, OH Phone Book
- Stow, OH Phone Book
- North Ridgeville, OH Phone Book
- Mason, OH Phone Book
- Fairborn, OH Phone Book
- Massillon, OH Phone Book
- Westlake, OH Phone Book
- Bowling Green, OH Phone Book
- North Olmsted, OH Phone Book
- North Royalton, OH Phone Book
- Kent, OH Phone Book
- Austintown, OH Phone Book
- Garfield Heights, OH Phone Book
- Shaker Heights, OH Phone Book
- Xenia, OH Phone Book
- Wooster, OH Phone Book
- Troy, OH Phone Book
- Barberton, OH Phone Book
- Medina, OH Phone Book
- Zanesville, OH Phone Book
- Athens, OH Phone Book
- Sandusky, OH Phone Book
- Marysville, OH Phone Book
- Trotwood, OH Phone Book
- Avon Lake, OH Phone Book
- Wadsworth, OH Phone Book
- Centerville, OH Phone Book
- Avon, OH Phone Book
- Oxford, OH Phone Book
- Willoughby, OH Phone Book
- Solon, OH Phone Book
- Hudson, OH Phone Book
- Maple Heights, OH Phone Book
- Alliance, OH Phone Book
- Chillicothe, OH Phone Book
- Perrysburg, OH Phone Book
- Pickerington, OH Phone Book
- Piqua, OH Phone Book
- Lebanon, OH Phone Book
- Sidney, OH Phone Book
- Ashland, OH Phone Book
- Rocky River, OH Phone Book
- Portsmouth, OH Phone Book
- Miamisburg, OH Phone Book
- Oregon, OH Phone Book
- Painesville, OH Phone Book
- Sylvania, OH Phone Book
- Twinsburg, OH Phone Book
- Berea, OH Phone Book
- Niles, OH Phone Book
- Springboro, OH Phone Book
- Eastlake, OH Phone Book
- Ashtabula, OH Phone Book
- Steubenville, OH Phone Book
- New Philadelphia, OH Phone Book
- Tiffin, OH Phone Book
- North Canton, OH Phone Book
- East Cleveland, OH Phone Book
- Norwalk, OH Phone Book
- Defiance, OH Phone Book
- Mount Vernon, OH Phone Book
- Streetsboro, OH Phone Book
- Aurora, OH Phone Book
- Fremont, OH Phone Book
- Pataskala, OH Phone Book
- Middleburg Heights, OH Phone Book
- Bay Village, OH Phone Book
- Vandalia, OH Phone Book
- Worthington, OH Phone Book
- Sharonville, OH Phone Book
- Washington Court House, OH Phone Book
- Monroe, OH Phone Book
- Circleville, OH Phone Book
- Loveland, OH Phone Book
- Bexley, OH Phone Book
- Maumee, OH Phone Book
- Marietta, OH Phone Book
- Brecksville, OH Phone Book
- Englewood, OH Phone Book
- Powell, OH Phone Book
- Bellefontaine, OH Phone Book
- Fostoria, OH Phone Book
- Warrensville Heights, OH Phone Book
- Trenton, OH Phone Book
- West Carrollton, OH Phone Book
- Harrison, OH Phone Book
- Dover, OH Phone Book
- Greenville, OH Phone Book
- Wickliffe, OH Phone Book
- Bedford, OH Phone Book
- Conneaut, OH Phone Book
- Wilmington, OH Phone Book
- Blue Ash, OH Phone Book
- Amherst, OH Phone Book
- Macedonia, OH Phone Book
- Franklin, OH Phone Book
- Bucyrus, OH Phone Book
- Salem, OH Phone Book
- Beachwood, OH Phone Book
- Ravenna, OH Phone Book
- Urbana, OH Phone Book
- New Albany, OH Phone Book
- Coshocton, OH Phone Book
- Heath, OH Phone Book
- Ironton, OH Phone Book
- East Liverpool, OH Phone Book
- Vermilion, OH Phone Book
- Van Wert, OH Phone Book
- Celina, OH Phone Book
- Cambridge, OH Phone Book
- London, OH Phone Book
- Tipp City, OH Phone Book
- Galion, OH Phone Book
- Wapakoneta, OH Phone Book
- Girard, OH Phone Book
- Canal Winchester, OH Phone Book
- Kenton, OH Phone Book
- Napoleon, OH Phone Book
- Shelby, OH Phone Book
- Orrville, OH Phone Book
- Oberlin, OH Phone Book
- Bryan, OH Phone Book
- St. Marys, OH Phone Book
- Eaton, OH Phone Book
- Bellevue, OH Phone Book
- Wauseon, OH Phone Book
- Canfield, OH Phone Book
- Independence, OH Phone Book
- Delphos, OH Phone Book
- Uniontown, OH Phone Book
- Huron, OH Phone Book
- Milford, OH Phone Book
- Cortland, OH Phone Book
- Logan, OH Phone Book
- Upper Sandusky, OH Phone Book
- Rossford, OH Phone Book
- Hillsboro, OH Phone Book
- Columbiana, OH Phone Book
- Rittman, OH Phone Book
- Belpre, OH Phone Book
- Brookville, OH Phone Book
- Jackson, OH Phone Book
- Port Clinton, OH Phone Book
- Clyde, OH Phone Book
- Willard, OH Phone Book
- Grafton, OH Phone Book
- Geneva, OH Phone Book
- Sunbury, OH Phone Book
- Granville, OH Phone Book
- Groveport, OH Phone Book
- New Carlisle, OH Phone Book
- Ada, OH Phone Book
- Chardon, OH Phone Book
- Johnstown, OH Phone Book
- St. Clairsville, OH Phone Book
- Nelsonville, OH Phone Book
- Newton Falls, OH Phone Book
- Georgetown, OH Phone Book
- Crestline, OH Phone Book
- Blanchester, OH Phone Book
- Archbold, OH Phone Book
- Ottawa, OH Phone Book
- Waverly, OH Phone Book
- Greenfield, OH Phone Book
- Newcomerstown, OH Phone Book
- Bluffton, OH Phone Book
- Yellow Springs, OH Phone Book
- Montpelier, OH Phone Book
- Chagrin Falls, OH Phone Book
- Plain City, OH Phone Book
- Richfield, OH Phone Book
- Mogadore, OH Phone Book
- Northfield, OH Phone Book
- Barnesville, OH Phone Book
- Gallipolis, OH Phone Book
- Jefferson, OH Phone Book
- Carrollton, OH Phone Book
- Millersburg, OH Phone Book
- Cadiz, OH Phone Book
- Madison, OH Phone Book
- Waynesville, OH Phone Book
- South Point, OH Phone Book
- Versailles, OH Phone Book
- Middlefield, OH Phone Book
- New Richmond, OH Phone Book
- Lisbon, OH Phone Book
- New Concord, OH Phone Book
- Arcanum, OH Phone Book
- Poland, OH Phone Book
- Hebron, OH Phone Book
- Gambier, OH Phone Book
- Batavia, OH Phone Book
- Caldwell, OH Phone Book
- Sugarcreek, OH Phone Book
- Piketon, OH Phone Book
- Genoa, OH Phone Book
- Lucasville, OH Phone Book
- Bellville, OH Phone Book
- Pomeroy, OH Phone Book
- Holland, OH Phone Book
- West Liberty, OH Phone Book
- Milan, OH Phone Book
- Burton, OH Phone Book
- Smithville, OH Phone Book
- Peninsula, OH Phone Book
- Proctorville, OH Phone Book
- Carroll, OH Phone Book
- Raymond, OH Phone Book
- Lewis Center, OH Phone Book
- Boardman, OH Phone Book
- Copley, OH Phone Book
- West Chester, OH Phone Book
- Liberty Township, OH Phone Book
Local Time in Yellow Springs, OH
Local Time
12:40 AM
Date
Tuesday, April 01, 2025
Time Zone
EDT
Yellow Springs, OH Population
Chicago has a population of 3972 people. Sex ratio is 83.50 males per 100 females.
Population by Age
The median age in Chicago is 34.8 years.
| Age Groups | Population |
|---|---|
| Under 5 years | 83 |
| 5 to 9 years | 251 |
| 10 to 14 years | 184 |
| 15 to 19 years | 200 |
| 20 to 24 years | 177 |
| 25 to 29 years | 88 |
| 30 to 34 years | 203 |
| 35 to 39 years | 57 |
| 40 to 44 years | 294 |
| 45 to 49 years | 207 |
| 50 to 54 years | 381 |
| 55 to 59 years | 236 |
| 60 to 64 years | 320 |
| 65 to 69 years | 363 |
| 70 to 74 years | 252 |
| 75 to 79 years | 201 |
| 80 to 84 years | 283 |
| 85 years and over | 192 |
Race & Ethnicity
| Racial/Ethnic Groups | Percent |
|---|---|
| White | 2904 |
| Black or African American | 336 |
| American Indian and Alaska Native | 25 |
| Native Hawaiian and Other Pacific Islander | 4 |
| Some Other Race | 50 |
| Two or more races | 333 |