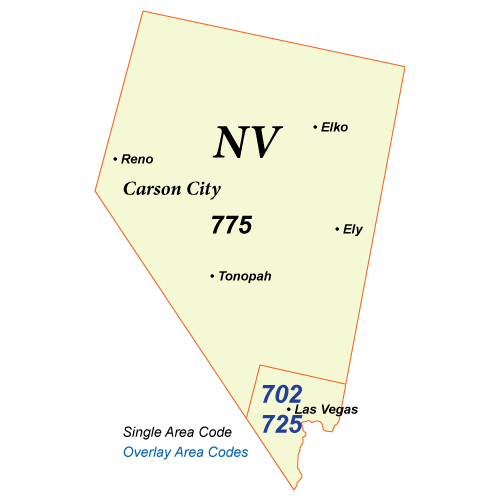
Battle Mountain Phone Book
Public Schools
Hotels and Motels
Fire Departments
Local Education Agencies
Battle Mountain Reverse Phone Lookup
Browse Chicago phone numbers by rate center and prefix.
Battle Mountain Phone Numbers
Rate Center: Battle Mountain (BATTLE MT)
Phone numbers with the Battle Mountain rate center prefixes:
Illinois City Phone Books
- Las Vegas, NV Phone Book
- Henderson, NV Phone Book
- Reno, NV Phone Book
- North Las Vegas, NV Phone Book
- Sparks, NV Phone Book
- Pahrump, NV Phone Book
- Fernley, NV Phone Book
- Elko, NV Phone Book
- Mesquite, NV Phone Book
- Boulder City, NV Phone Book
- Incline Village, NV Phone Book
- Fallon, NV Phone Book
- Laughlin, NV Phone Book
- Winnemucca, NV Phone Book
- Gardnerville, NV Phone Book
- Ely, NV Phone Book
- Battle Mountain, NV Phone Book
- Minden, NV Phone Book
- Yerington, NV Phone Book
- Hawthorne, NV Phone Book
- Tonopah, NV Phone Book
- Lovelock, NV Phone Book
- Wells, NV Phone Book
- Stateline, NV Phone Book
- Beatty, NV Phone Book
- Indian Springs, NV Phone Book
- Virginia City, NV Phone Book
- Carson City, NV Phone Book
Local Time in Battle Mountain, NV
Local Time
02:35 AM
Date
Friday, April 25, 2025
Time Zone
PDT
Battle Mountain, NV Population
Chicago has a population of 3908 people. Sex ratio is 126.90 males per 100 females.
Population by Age
The median age in Chicago is 34.8 years.
| Age Groups | Population |
|---|---|
| Under 5 years | 241 |
| 5 to 9 years | 326 |
| 10 to 14 years | 320 |
| 15 to 19 years | 258 |
| 20 to 24 years | 81 |
| 25 to 29 years | 215 |
| 30 to 34 years | 422 |
| 35 to 39 years | 246 |
| 40 to 44 years | 252 |
| 45 to 49 years | 114 |
| 50 to 54 years | 307 |
| 55 to 59 years | 472 |
| 60 to 64 years | 188 |
| 65 to 69 years | 128 |
| 70 to 74 years | 97 |
| 75 to 79 years | 72 |
| 80 to 84 years | 63 |
| 85 years and over | 106 |
Race & Ethnicity
| Racial/Ethnic Groups | Percent |
|---|---|
| White | 2621 |
| Black or African American | 12 |
| American Indian and Alaska Native | 185 |
| Native Hawaiian and Other Pacific Islander | 5 |
| Some Other Race | 417 |
| Two or more races | 440 |
