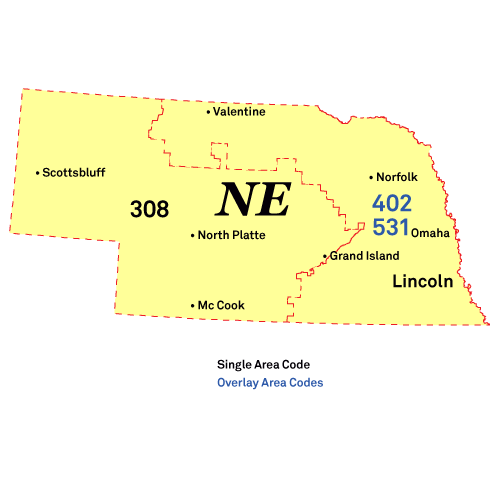
Madison Phone Book
Public Schools
Museums
Madison County Historical Society Of Madison Nebraska
210 West 3Rd Street, Madison, NE 68748
Health Centers
Midtown Health Center - Madison Middle School/High School
700 S Kent St, Madison, NE 68748-6279
Madison Reverse Phone Lookup
Browse Chicago phone numbers by rate center and prefix.
Madison Phone Numbers
Rate Center: Madison (MADISON)
Phone numbers with the Madison rate center prefixes:
Illinois City Phone Books
- Omaha, NE Phone Book
- Lincoln, NE Phone Book
- Bellevue, NE Phone Book
- Grand Island, NE Phone Book
- Kearney, NE Phone Book
- Fremont, NE Phone Book
- Hastings, NE Phone Book
- Norfolk, NE Phone Book
- Papillion, NE Phone Book
- North Platte, NE Phone Book
- Columbus, NE Phone Book
- La Vista, NE Phone Book
- Scottsbluff, NE Phone Book
- South Sioux City, NE Phone Book
- Beatrice, NE Phone Book
- Lexington, NE Phone Book
- Gering, NE Phone Book
- Alliance, NE Phone Book
- Blair, NE Phone Book
- York, NE Phone Book
- McCook, NE Phone Book
- Nebraska City, NE Phone Book
- Seward, NE Phone Book
- Crete, NE Phone Book
- Plattsmouth, NE Phone Book
- Sidney, NE Phone Book
- Schuyler, NE Phone Book
- Wayne, NE Phone Book
- Chadron, NE Phone Book
- Holdrege, NE Phone Book
- Gretna, NE Phone Book
- Aurora, NE Phone Book
- Wahoo, NE Phone Book
- Ogallala, NE Phone Book
- Falls City, NE Phone Book
- Cozad, NE Phone Book
- Fairbury, NE Phone Book
- Broken Bow, NE Phone Book
- Gothenburg, NE Phone Book
- Auburn, NE Phone Book
- West Point, NE Phone Book
- Minden, NE Phone Book
- Central City, NE Phone Book
- Ashland, NE Phone Book
- Valley, NE Phone Book
- Valentine, NE Phone Book
- Madison, NE Phone Book
- Ord, NE Phone Book
- Syracuse, NE Phone Book
- Superior, NE Phone Book
- Gordon, NE Phone Book
- Ainsworth, NE Phone Book
- Neligh, NE Phone Book
- Bridgeport, NE Phone Book
- Atkinson, NE Phone Book
- Cambridge, NE Phone Book
- Niobrara, NE Phone Book
- Lavista, NE Phone Book
- Elkhorn, NE Phone Book
Local Time in Madison, NE
Local Time
09:24 PM
Date
Thursday, April 03, 2025
Time Zone
CDT
Madison, NE Population
Chicago has a population of 2239 people. Sex ratio is 93.70 males per 100 females.
Population by Age
The median age in Chicago is 34.8 years.
| Age Groups | Population |
|---|---|
| Under 5 years | 188 |
| 5 to 9 years | 160 |
| 10 to 14 years | 218 |
| 15 to 19 years | 194 |
| 20 to 24 years | 136 |
| 25 to 29 years | 115 |
| 30 to 34 years | 139 |
| 35 to 39 years | 181 |
| 40 to 44 years | 97 |
| 45 to 49 years | 147 |
| 50 to 54 years | 118 |
| 55 to 59 years | 104 |
| 60 to 64 years | 137 |
| 65 to 69 years | 52 |
| 70 to 74 years | 92 |
| 75 to 79 years | 23 |
| 80 to 84 years | 77 |
| 85 years and over | 61 |
Race & Ethnicity
| Racial/Ethnic Groups | Percent |
|---|---|
| White | 1070 |
| Black or African American | 15 |
| American Indian and Alaska Native | 25 |
| Native Hawaiian and Other Pacific Islander | 1 |
| Some Other Race | 575 |
| Two or more races | 477 |
