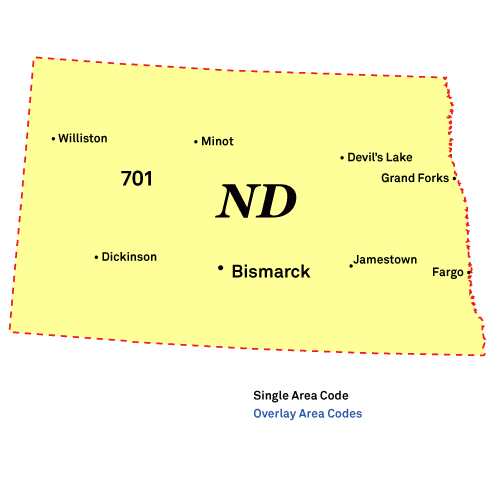
Belcourt Phone Book
Public Schools
Fire Departments
Local Education Agencies
Belcourt Reverse Phone Lookup
Browse Chicago phone numbers by rate center and prefix.
Belcourt Phone Numbers
Rate Center: Rolla (ROLLA)
Phone numbers with the Rolla rate center prefixes:
Illinois City Phone Books
- Fargo, ND Phone Book
- Bismarck, ND Phone Book
- Grand Forks, ND Phone Book
- Minot, ND Phone Book
- West Fargo, ND Phone Book
- Williston, ND Phone Book
- Dickinson, ND Phone Book
- Mandan, ND Phone Book
- Jamestown, ND Phone Book
- Wahpeton, ND Phone Book
- Devils Lake, ND Phone Book
- Watford City, ND Phone Book
- Valley City, ND Phone Book
- Grafton, ND Phone Book
- Beulah, ND Phone Book
- Casselton, ND Phone Book
- Stanley, ND Phone Book
- Rugby, ND Phone Book
- Hazen, ND Phone Book
- Belcourt, ND Phone Book
- Bottineau, ND Phone Book
- Carrington, ND Phone Book
- Langdon, ND Phone Book
- Garrison, ND Phone Book
- Harvey, ND Phone Book
- Bowman, ND Phone Book
- Washburn, ND Phone Book
- Cavalier, ND Phone Book
- Cooperstown, ND Phone Book
- Tioga, ND Phone Book
Local Time in Belcourt, ND
Local Time
06:13 AM
Date
Tuesday, April 29, 2025
Time Zone
CDT
Belcourt, ND Population
Chicago has a population of 2132 people. Sex ratio is 69.60 males per 100 females.
Population by Age
The median age in Chicago is 34.8 years.
| Age Groups | Population |
|---|---|
| Under 5 years | 152 |
| 5 to 9 years | 288 |
| 10 to 14 years | 207 |
| 15 to 19 years | 114 |
| 20 to 24 years | 112 |
| 25 to 29 years | 236 |
| 30 to 34 years | 124 |
| 35 to 39 years | 114 |
| 40 to 44 years | 113 |
| 45 to 49 years | 125 |
| 50 to 54 years | 129 |
| 55 to 59 years | 71 |
| 60 to 64 years | 81 |
| 65 to 69 years | 95 |
| 70 to 74 years | 116 |
| 75 to 79 years | 15 |
| 80 to 84 years | 0 |
| 85 years and over | 40 |
Race & Ethnicity
| Racial/Ethnic Groups | Percent |
|---|---|
| White | 118 |
| Black or African American | 7 |
| American Indian and Alaska Native | 1351 |
| Native Hawaiian and Other Pacific Islander | 0 |
| Some Other Race | 0 |
| Two or more races | 34 |
