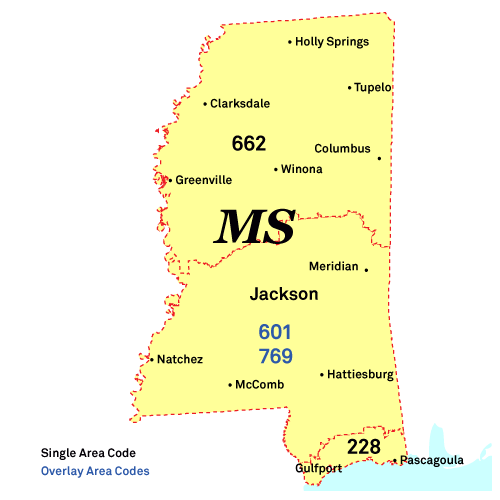
Louisville Phone Book
Public Schools
Hotels and Motels
Health Centers
Fire Departments
Local Education Agencies
Louisville Municipal School Dist
891 South Columbus Ave P. O. Box 909, Louisville, MS 39339
Louisville Reverse Phone Lookup
Browse Chicago phone numbers by rate center and prefix.
Louisville Phone Numbers
Rate Center: Louisville (LOUISVILLE)
Phone numbers with the Louisville rate center prefixes:
Illinois City Phone Books
- Jackson, MS Phone Book
- Gulfport, MS Phone Book
- Southaven, MS Phone Book
- Biloxi, MS Phone Book
- Hattiesburg, MS Phone Book
- Olive Branch, MS Phone Book
- Tupelo, MS Phone Book
- Meridian, MS Phone Book
- Greenville, MS Phone Book
- Oxford, MS Phone Book
- Horn Lake, MS Phone Book
- Pearl, MS Phone Book
- Madison, MS Phone Book
- Starkville, MS Phone Book
- Clinton, MS Phone Book
- Ridgeland, MS Phone Book
- Brandon, MS Phone Book
- Columbus, MS Phone Book
- Vicksburg, MS Phone Book
- Pascagoula, MS Phone Book
- Gautier, MS Phone Book
- Laurel, MS Phone Book
- Ocean Springs, MS Phone Book
- Hernando, MS Phone Book
- Long Beach, MS Phone Book
- Clarksdale, MS Phone Book
- Natchez, MS Phone Book
- Corinth, MS Phone Book
- Greenwood, MS Phone Book
- D'Iberville, MS Phone Book
- Bay St. Louis, MS Phone Book
- Moss Point, MS Phone Book
- McComb, MS Phone Book
- Grenada, MS Phone Book
- Brookhaven, MS Phone Book
- Canton, MS Phone Book
- Cleveland, MS Phone Book
- Picayune, MS Phone Book
- Yazoo City, MS Phone Book
- Petal, MS Phone Book
- West Point, MS Phone Book
- Indianola, MS Phone Book
- Flowood, MS Phone Book
- New Albany, MS Phone Book
- Booneville, MS Phone Book
- Senatobia, MS Phone Book
- Holly Springs, MS Phone Book
- Richland, MS Phone Book
- Batesville, MS Phone Book
- Philadelphia, MS Phone Book
- Amory, MS Phone Book
- Kosciusko, MS Phone Book
- Pass Christian, MS Phone Book
- Pontotoc, MS Phone Book
- Louisville, MS Phone Book
- Columbia, MS Phone Book
- Forest, MS Phone Book
- Leakesville, MS Phone Book
- Aberdeen, MS Phone Book
- Ripley, MS Phone Book
- Vancleave, MS Phone Book
- Waynesboro, MS Phone Book
- Carthage, MS Phone Book
- Ellisville, MS Phone Book
- Wiggins, MS Phone Book
- Florence, MS Phone Book
- Magee, MS Phone Book
- Winona, MS Phone Book
- Fulton, MS Phone Book
- Leland, MS Phone Book
- Hazlehurst, MS Phone Book
- Houston, MS Phone Book
- Newton, MS Phone Book
- Lucedale, MS Phone Book
- Macon, MS Phone Book
- Mendenhall, MS Phone Book
- Magnolia, MS Phone Book
- Iuka, MS Phone Book
- Collins, MS Phone Book
- Poplarville, MS Phone Book
- Kiln, MS Phone Book
- Nettleton, MS Phone Book
- Purvis, MS Phone Book
- Belzoni, MS Phone Book
- Raymond, MS Phone Book
- Tylertown, MS Phone Book
- Quitman, MS Phone Book
- Mantachie, MS Phone Book
- Ackerman, MS Phone Book
- Lumberton, MS Phone Book
- Byhalia, MS Phone Book
- Port Gibson, MS Phone Book
- Coldwater, MS Phone Book
- Lexington, MS Phone Book
- Fayette, MS Phone Book
- Richton, MS Phone Book
- Monticello, MS Phone Book
- Prentiss, MS Phone Book
- Tunica, MS Phone Book
- Liberty, MS Phone Book
- Meadville, MS Phone Book
- Ashland, MS Phone Book
- Seminary, MS Phone Book
- Robinsonville, MS Phone Book
Local Time in Louisville, MS
Local Time
11:17 AM
Date
Thursday, April 03, 2025
Time Zone
CDT
Louisville, MS Population
Chicago has a population of 6063 people. Sex ratio is 91.10 males per 100 females.
Population by Age
The median age in Chicago is 34.8 years.
| Age Groups | Population |
|---|---|
| Under 5 years | 247 |
| 5 to 9 years | 307 |
| 10 to 14 years | 623 |
| 15 to 19 years | 461 |
| 20 to 24 years | 394 |
| 25 to 29 years | 186 |
| 30 to 34 years | 327 |
| 35 to 39 years | 528 |
| 40 to 44 years | 338 |
| 45 to 49 years | 355 |
| 50 to 54 years | 179 |
| 55 to 59 years | 396 |
| 60 to 64 years | 408 |
| 65 to 69 years | 253 |
| 70 to 74 years | 323 |
| 75 to 79 years | 336 |
| 80 to 84 years | 168 |
| 85 years and over | 234 |
Race & Ethnicity
| Racial/Ethnic Groups | Percent |
|---|---|
| White | 1929 |
| Black or African American | 3928 |
| American Indian and Alaska Native | 20 |
| Native Hawaiian and Other Pacific Islander | 1 |
| Some Other Race | 52 |
| Two or more races | 114 |
