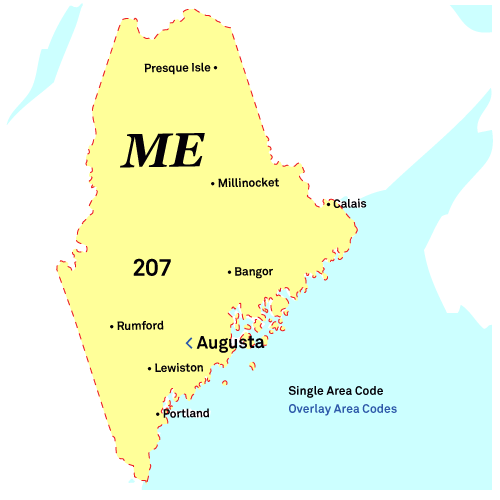
Lincoln Phone Book
Public Schools
Health Centers
Local Education Agencies
Lincoln Reverse Phone Lookup
Browse Chicago phone numbers by rate center and prefix.
Lincoln Phone Numbers
Rate Center: Lincoln (LINCOLN)
Phone numbers with the Lincoln rate center prefixes:
Illinois City Phone Books
- Portland, ME Phone Book
- Lewiston, ME Phone Book
- Bangor, ME Phone Book
- South Portland, ME Phone Book
- Auburn, ME Phone Book
- Biddeford, ME Phone Book
- Sanford, ME Phone Book
- Saco, ME Phone Book
- Westbrook, ME Phone Book
- Augusta, ME Phone Book
- Waterville, ME Phone Book
- Brunswick, ME Phone Book
- Orono, ME Phone Book
- Presque Isle, ME Phone Book
- Brewer, ME Phone Book
- Old Orchard Beach, ME Phone Book
- Bath, ME Phone Book
- Ellsworth, ME Phone Book
- Caribou, ME Phone Book
- Old Town, ME Phone Book
- Gorham, ME Phone Book
- Rockland, ME Phone Book
- Belfast, ME Phone Book
- Skowhegan, ME Phone Book
- Topsham, ME Phone Book
- Kennebunk, ME Phone Book
- Yarmouth, ME Phone Book
- Kittery, ME Phone Book
- Houlton, ME Phone Book
- Farmington, ME Phone Book
- Millinocket, ME Phone Book
- Camden, ME Phone Book
- Pittsfield, ME Phone Book
- Calais, ME Phone Book
- Bucksport, ME Phone Book
- Lincoln, ME Phone Book
- Fairfield, ME Phone Book
- Fort Kent, ME Phone Book
- Bar Harbor, ME Phone Book
- Newport, ME Phone Book
- Freeport, ME Phone Book
- Falmouth, ME Phone Book
- Bridgton, ME Phone Book
- South Paris, ME Phone Book
- Wilton, ME Phone Book
- Machias, ME Phone Book
- Damariscotta, ME Phone Book
- Eastport, ME Phone Book
- Wiscasset, ME Phone Book
- Blue Hill, ME Phone Book
- Greenville, ME Phone Book
- Kennebunkport, ME Phone Book
- Boothbay Harbor, ME Phone Book
- Searsport, ME Phone Book
- Rangeley, ME Phone Book
- Bethel, ME Phone Book
- York, ME Phone Book
- Lee, ME Phone Book
- Baileyville, ME Phone Book
- Jackman, ME Phone Book
- Wells, ME Phone Book
- Ogunquit, ME Phone Book
- Scarborough, ME Phone Book
- Rockport, ME Phone Book
- Windham, ME Phone Book
- Cape Elizabeth, ME Phone Book
Local Time in Lincoln, ME
Local Time
12:53 AM
Date
Friday, April 04, 2025
Time Zone
EDT
Lincoln, ME Population
Chicago has a population of 2606 people. Sex ratio is 90.90 males per 100 females.
Population by Age
The median age in Chicago is 34.8 years.
| Age Groups | Population |
|---|---|
| Under 5 years | 80 |
| 5 to 9 years | 57 |
| 10 to 14 years | 83 |
| 15 to 19 years | 87 |
| 20 to 24 years | 73 |
| 25 to 29 years | 122 |
| 30 to 34 years | 60 |
| 35 to 39 years | 138 |
| 40 to 44 years | 30 |
| 45 to 49 years | 119 |
| 50 to 54 years | 128 |
| 55 to 59 years | 167 |
| 60 to 64 years | 469 |
| 65 to 69 years | 306 |
| 70 to 74 years | 490 |
| 75 to 79 years | 28 |
| 80 to 84 years | 88 |
| 85 years and over | 81 |
Race & Ethnicity
| Racial/Ethnic Groups | Percent |
|---|---|
| White | 2520 |
| Black or African American | 5 |
| American Indian and Alaska Native | 22 |
| Native Hawaiian and Other Pacific Islander | 0 |
| Some Other Race | 6 |
| Two or more races | 100 |
