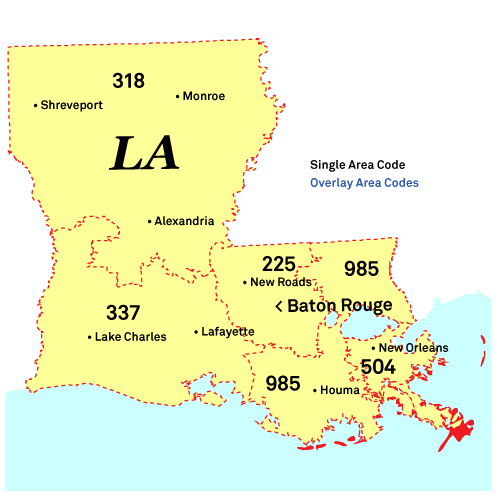
Prairieville Phone Book
Public Schools
Fire Departments
Prairieville Reverse Phone Lookup
Browse Chicago phone numbers by rate center and prefix.
Prairieville Phone Numbers
Rate Center: Dutch Town (DUTCH TOWN)
Phone numbers with the Dutch Town rate center prefixes:
Illinois City Phone Books
- New Orleans, LA Phone Book
- Baton Rouge, LA Phone Book
- Shreveport, LA Phone Book
- Metairie, LA Phone Book
- Lafayette, LA Phone Book
- Lake Charles, LA Phone Book
- Bossier City, LA Phone Book
- Kenner, LA Phone Book
- Monroe, LA Phone Book
- Alexandria, LA Phone Book
- Prairieville, LA Phone Book
- Houma, LA Phone Book
- Marrero, LA Phone Book
- Laplace, LA Phone Book
- New Iberia, LA Phone Book
- Slidell, LA Phone Book
- Chalmette, LA Phone Book
- Ruston, LA Phone Book
- Harvey, LA Phone Book
- Hammond, LA Phone Book
- Sulphur, LA Phone Book
- Gretna, LA Phone Book
- Natchitoches, LA Phone Book
- Zachary, LA Phone Book
- Opelousas, LA Phone Book
- Thibodaux, LA Phone Book
- Luling, LA Phone Book
- Pineville, LA Phone Book
- Youngsville, LA Phone Book
- Baker, LA Phone Book
- Crowley, LA Phone Book
- Mandeville, LA Phone Book
- West Monroe, LA Phone Book
- Broussard, LA Phone Book
- Abbeville, LA Phone Book
- Minden, LA Phone Book
- Bogalusa, LA Phone Book
- Morgan City, LA Phone Book
- DeRidder, LA Phone Book
- Gonzales, LA Phone Book
- Covington, LA Phone Book
- Jefferson, LA Phone Book
- Belle Chasse, LA Phone Book
- Bastrop, LA Phone Book
- Denham Springs, LA Phone Book
- Jennings, LA Phone Book
- Eunice, LA Phone Book
- Scott, LA Phone Book
- Donaldsonville, LA Phone Book
- Westwego, LA Phone Book
- Breaux Bridge, LA Phone Book
- Rayne, LA Phone Book
- Ponchatoula, LA Phone Book
- Ville Platte, LA Phone Book
- Franklin, LA Phone Book
- Tallulah, LA Phone Book
- Plaquemine, LA Phone Book
- Walker, LA Phone Book
- Leesville, LA Phone Book
- Marksville, LA Phone Book
- Port Allen, LA Phone Book
- Mansfield, LA Phone Book
- Jonesboro, LA Phone Book
- New Roads, LA Phone Book
- Winnfield, LA Phone Book
- Bunkie, LA Phone Book
- Vidalia, LA Phone Book
- Franklinton, LA Phone Book
- Farmerville, LA Phone Book
- Rayville, LA Phone Book
- Jena, LA Phone Book
- Vinton, LA Phone Book
- Haughton, LA Phone Book
- Ferriday, LA Phone Book
- DeQuincy, LA Phone Book
- Homer, LA Phone Book
- Delhi, LA Phone Book
- Pearl River, LA Phone Book
- Kinder, LA Phone Book
- Lake Providence, LA Phone Book
- Independence, LA Phone Book
- Kentwood, LA Phone Book
- Clinton, LA Phone Book
- Greensburg, LA Phone Book
- Columbia, LA Phone Book
- Amite, LA Phone Book
Local Time in Prairieville, LA
Local Time
02:33 AM
Date
Saturday, April 26, 2025
Time Zone
CDT
Prairieville, LA Population
Chicago has a population of 33228 people. Sex ratio is 97.30 males per 100 females.
Population by Age
The median age in Chicago is 34.8 years.
| Age Groups | Population |
|---|---|
| Under 5 years | 2863 |
| 5 to 9 years | 3009 |
| 10 to 14 years | 2030 |
| 15 to 19 years | 2159 |
| 20 to 24 years | 1446 |
| 25 to 29 years | 2160 |
| 30 to 34 years | 2216 |
| 35 to 39 years | 2656 |
| 40 to 44 years | 2936 |
| 45 to 49 years | 2048 |
| 50 to 54 years | 2140 |
| 55 to 59 years | 2724 |
| 60 to 64 years | 1317 |
| 65 to 69 years | 1432 |
| 70 to 74 years | 757 |
| 75 to 79 years | 428 |
| 80 to 84 years | 695 |
| 85 years and over | 212 |
Race & Ethnicity
| Racial/Ethnic Groups | Percent |
|---|---|
| White | 23906 |
| Black or African American | 4867 |
| American Indian and Alaska Native | 105 |
| Native Hawaiian and Other Pacific Islander | 12 |
| Some Other Race | 1212 |
| Two or more races | 2267 |
