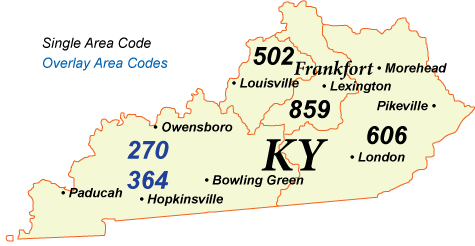
Grayson Phone Book
Public Schools
Hotels and Motels
Health Centers
Grayson Reverse Phone Lookup
Browse Chicago phone numbers by rate center and prefix.
Grayson Phone Numbers
Rate Center: Grayson (GRAYSON)
Phone numbers with the Grayson rate center prefixes:
Illinois City Phone Books
- Louisville, KY Phone Book
- Lexington, KY Phone Book
- Bowling Green, KY Phone Book
- Owensboro, KY Phone Book
- Covington, KY Phone Book
- Richmond, KY Phone Book
- Georgetown, KY Phone Book
- Florence, KY Phone Book
- Hopkinsville, KY Phone Book
- Nicholasville, KY Phone Book
- Elizabethtown, KY Phone Book
- Henderson, KY Phone Book
- Frankfort, KY Phone Book
- Paducah, KY Phone Book
- Radcliff, KY Phone Book
- Ashland, KY Phone Book
- Murray, KY Phone Book
- Erlanger, KY Phone Book
- Madisonville, KY Phone Book
- Winchester, KY Phone Book
- Burlington, KY Phone Book
- Danville, KY Phone Book
- Fort Thomas, KY Phone Book
- Shelbyville, KY Phone Book
- Berea, KY Phone Book
- Newport, KY Phone Book
- Mount Washington, KY Phone Book
- Glasgow, KY Phone Book
- Shepherdsville, KY Phone Book
- Bardstown, KY Phone Book
- Somerset, KY Phone Book
- Lawrenceburg, KY Phone Book
- Campbellsville, KY Phone Book
- Mayfield, KY Phone Book
- Paris, KY Phone Book
- Alexandria, KY Phone Book
- Versailles, KY Phone Book
- Franklin, KY Phone Book
- Fort Knox, KY Phone Book
- Maysville, KY Phone Book
- Harrodsburg, KY Phone Book
- London, KY Phone Book
- Morehead, KY Phone Book
- Corbin, KY Phone Book
- Oak Grove, KY Phone Book
- Mount Sterling, KY Phone Book
- Russellville, KY Phone Book
- Hebron, KY Phone Book
- Leitchfield, KY Phone Book
- Pikeville, KY Phone Book
- Cynthiana, KY Phone Book
- Princeton, KY Phone Book
- Monticello, KY Phone Book
- Union, KY Phone Book
- Lebanon, KY Phone Book
- Central City, KY Phone Book
- Williamsburg, KY Phone Book
- Crestwood, KY Phone Book
- Hazard, KY Phone Book
- Columbia, KY Phone Book
- Benton, KY Phone Book
- Scottsville, KY Phone Book
- Walton, KY Phone Book
- Greenville, KY Phone Book
- Paintsville, KY Phone Book
- Williamstown, KY Phone Book
- Grayson, KY Phone Book
- Lancaster, KY Phone Book
- Carrollton, KY Phone Book
- Stanford, KY Phone Book
- Prestonsburg, KY Phone Book
- Morganfield, KY Phone Book
- West Liberty, KY Phone Book
- Hodgenville, KY Phone Book
- Barbourville, KY Phone Book
- Springfield, KY Phone Book
- Marion, KY Phone Book
- Brandenburg, KY Phone Book
- Louisa, KY Phone Book
- Flemingsburg, KY Phone Book
- Tompkinsville, KY Phone Book
- Hartford, KY Phone Book
- Morgantown, KY Phone Book
- Stanton, KY Phone Book
- Irvine, KY Phone Book
- Cadiz, KY Phone Book
- Russell Springs, KY Phone Book
- Cave City, KY Phone Book
- Eddyville, KY Phone Book
- Albany, KY Phone Book
- Carlisle, KY Phone Book
- Greensburg, KY Phone Book
- Whitesburg, KY Phone Book
- Jackson, KY Phone Book
- Manchester, KY Phone Book
- Mount Vernon, KY Phone Book
- Owingsville, KY Phone Book
- Dry Ridge, KY Phone Book
- Warsaw, KY Phone Book
- Liberty, KY Phone Book
- Salyersville, KY Phone Book
- Burkesville, KY Phone Book
- Pineville, KY Phone Book
- Owenton, KY Phone Book
- Taylorsville, KY Phone Book
- Olive Hill, KY Phone Book
- Beattyville, KY Phone Book
- Harlan, KY Phone Book
- Vanceburg, KY Phone Book
- Inez, KY Phone Book
- Brownsville, KY Phone Book
- Evarts, KY Phone Book
- Hindman, KY Phone Book
- Cecilia, KY Phone Book
- Barlow, KY Phone Book
- Hyden, KY Phone Book
- Booneville, KY Phone Book
- Middlesboro, KY Phone Book
- Louisville, KY Phone Book
- Fort Campbell, KY Phone Book
Local Time in Grayson, KY
Local Time
08:33 AM
Date
Tuesday, April 29, 2025
Time Zone
EDT
Grayson, KY Population
Chicago has a population of 3910 people. Sex ratio is 115.10 males per 100 females.
Population by Age
The median age in Chicago is 34.8 years.
| Age Groups | Population |
|---|---|
| Under 5 years | 170 |
| 5 to 9 years | 321 |
| 10 to 14 years | 139 |
| 15 to 19 years | 198 |
| 20 to 24 years | 476 |
| 25 to 29 years | 376 |
| 30 to 34 years | 292 |
| 35 to 39 years | 248 |
| 40 to 44 years | 300 |
| 45 to 49 years | 129 |
| 50 to 54 years | 93 |
| 55 to 59 years | 179 |
| 60 to 64 years | 271 |
| 65 to 69 years | 267 |
| 70 to 74 years | 166 |
| 75 to 79 years | 49 |
| 80 to 84 years | 104 |
| 85 years and over | 132 |
Race & Ethnicity
| Racial/Ethnic Groups | Percent |
|---|---|
| White | 3452 |
| Black or African American | 177 |
| American Indian and Alaska Native | 16 |
| Native Hawaiian and Other Pacific Islander | 0 |
| Some Other Race | 33 |
| Two or more races | 130 |
