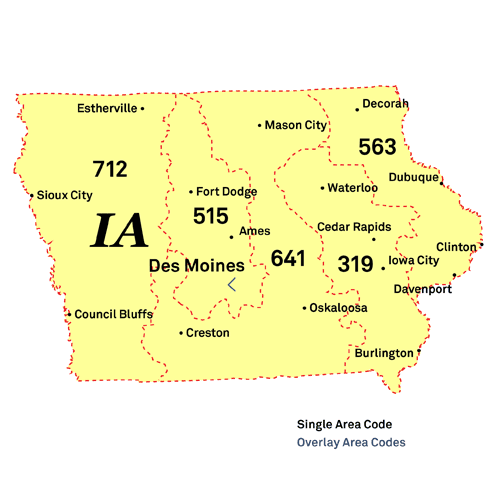
Webster City Phone Book
Public Schools
Hotels and Motels
Alternative Fuel Stations
Fire Departments
Local Education Agencies
Webster City Reverse Phone Lookup
Browse Chicago phone numbers by rate center and prefix.
Webster City Phone Numbers
Rate Center: Webster City (WEBSTER CY)
Phone numbers with the Webster City rate center prefixes:
Illinois City Phone Books
- Des Moines, IA Phone Book
- Cedar Rapids, IA Phone Book
- Davenport, IA Phone Book
- Sioux City, IA Phone Book
- Iowa City, IA Phone Book
- Waterloo, IA Phone Book
- West Des Moines, IA Phone Book
- Ames, IA Phone Book
- Ankeny, IA Phone Book
- Council Bluffs, IA Phone Book
- Dubuque, IA Phone Book
- Urbandale, IA Phone Book
- Cedar Falls, IA Phone Book
- Marion, IA Phone Book
- Bettendorf, IA Phone Book
- Mason City, IA Phone Book
- Marshalltown, IA Phone Book
- Clinton, IA Phone Book
- Burlington, IA Phone Book
- Ottumwa, IA Phone Book
- Fort Dodge, IA Phone Book
- Muscatine, IA Phone Book
- Waukee, IA Phone Book
- Johnston, IA Phone Book
- Coralville, IA Phone Book
- North Liberty, IA Phone Book
- Altoona, IA Phone Book
- Clive, IA Phone Book
- Indianola, IA Phone Book
- Newton, IA Phone Book
- Grimes, IA Phone Book
- Boone, IA Phone Book
- Oskaloosa, IA Phone Book
- Norwalk, IA Phone Book
- Spencer, IA Phone Book
- Storm Lake, IA Phone Book
- Fort Madison, IA Phone Book
- Fairfield, IA Phone Book
- Pella, IA Phone Book
- Keokuk, IA Phone Book
- Waverly, IA Phone Book
- Le Mars, IA Phone Book
- Pleasant Hill, IA Phone Book
- Carroll, IA Phone Book
- Grinnell, IA Phone Book
- Mount Pleasant, IA Phone Book
- Denison, IA Phone Book
- Creston, IA Phone Book
- Webster City, IA Phone Book
- Perry, IA Phone Book
- Decorah, IA Phone Book
- Clear Lake, IA Phone Book
- Sioux Center, IA Phone Book
- Charles City, IA Phone Book
- Washington, IA Phone Book
- Knoxville, IA Phone Book
- Nevada, IA Phone Book
- Eldridge, IA Phone Book
- Atlantic, IA Phone Book
- Orange City, IA Phone Book
- Independence, IA Phone Book
- Maquoketa, IA Phone Book
- Oelwein, IA Phone Book
- Estherville, IA Phone Book
- Anamosa, IA Phone Book
- Centerville, IA Phone Book
- Algona, IA Phone Book
- Clarinda, IA Phone Book
- Red Oak, IA Phone Book
- Winterset, IA Phone Book
- Sheldon, IA Phone Book
- Osceola, IA Phone Book
- Spirit Lake, IA Phone Book
- Vinton, IA Phone Book
- Iowa Falls, IA Phone Book
- Manchester, IA Phone Book
- Adel, IA Phone Book
- Sergeant Bluff, IA Phone Book
- Cherokee, IA Phone Book
- Shenandoah, IA Phone Book
- Harlan, IA Phone Book
- Humboldt, IA Phone Book
- Hampton, IA Phone Book
- Dyersville, IA Phone Book
- Chariton, IA Phone Book
- Jefferson, IA Phone Book
- Forest City, IA Phone Book
- Rock Valley, IA Phone Book
- Carter Lake, IA Phone Book
- Cresco, IA Phone Book
- Albia, IA Phone Book
- Emmetsburg, IA Phone Book
- Waukon, IA Phone Book
- Osage, IA Phone Book
- New Hampton, IA Phone Book
- Story City, IA Phone Book
- Tipton, IA Phone Book
- Williamsburg, IA Phone Book
- West Burlington, IA Phone Book
- Clarion, IA Phone Book
- Bloomfield, IA Phone Book
- Grundy Center, IA Phone Book
- West Union, IA Phone Book
- Missouri Valley, IA Phone Book
- Sibley, IA Phone Book
- Madrid, IA Phone Book
- Rock Rapids, IA Phone Book
- Postville, IA Phone Book
- West Branch, IA Phone Book
- Lamoni, IA Phone Book
- Northwood, IA Phone Book
- Ida Grove, IA Phone Book
- Sigourney, IA Phone Book
- Colfax, IA Phone Book
- Leon, IA Phone Book
- Walcott, IA Phone Book
- Guttenberg, IA Phone Book
- Corning, IA Phone Book
- Corydon, IA Phone Book
- Fairbank, IA Phone Book
- Avoca, IA Phone Book
- Eldon, IA Phone Book
Local Time in Webster City, IA
Local Time
04:37 AM
Date
Friday, March 14, 2025
Time Zone
CDT
Webster City, IA Population
Chicago has a population of 7699 people. Sex ratio is 99.00 males per 100 females.
Population by Age
The median age in Chicago is 34.8 years.
| Age Groups | Population |
|---|---|
| Under 5 years | 529 |
| 5 to 9 years | 411 |
| 10 to 14 years | 643 |
| 15 to 19 years | 335 |
| 20 to 24 years | 365 |
| 25 to 29 years | 339 |
| 30 to 34 years | 506 |
| 35 to 39 years | 442 |
| 40 to 44 years | 537 |
| 45 to 49 years | 441 |
| 50 to 54 years | 410 |
| 55 to 59 years | 528 |
| 60 to 64 years | 398 |
| 65 to 69 years | 327 |
| 70 to 74 years | 544 |
| 75 to 79 years | 256 |
| 80 to 84 years | 160 |
| 85 years and over | 528 |
Race & Ethnicity
| Racial/Ethnic Groups | Percent |
|---|---|
| White | 6320 |
| Black or African American | 75 |
| American Indian and Alaska Native | 56 |
| Native Hawaiian and Other Pacific Islander | 0 |
| Some Other Race | 582 |
| Two or more races | 490 |
