Bristol Phone Book
Public Schools
Libraries
Health Centers
Fire Departments
Bristol Reverse Phone Lookup
Browse Chicago phone numbers by rate center and prefix.
Bristol Phone Numbers
Rate Center: Bristol (BRISTOL)
Phone numbers with the Bristol rate center prefixes:
Illinois City Phone Books
- Jacksonville, FL Phone Book
- Miami, FL Phone Book
- Tampa, FL Phone Book
- Orlando, FL Phone Book
- St. Petersburg, FL Phone Book
- Hialeah, FL Phone Book
- Port St. Lucie, FL Phone Book
- Tallahassee, FL Phone Book
- Cape Coral, FL Phone Book
- Fort Lauderdale, FL Phone Book
- Pembroke Pines, FL Phone Book
- Hollywood, FL Phone Book
- Miramar, FL Phone Book
- Gainesville, FL Phone Book
- Coral Springs, FL Phone Book
- Lehigh Acres, FL Phone Book
- Clearwater, FL Phone Book
- Brandon, FL Phone Book
- Palm Bay, FL Phone Book
- Spring Hill, FL Phone Book
- Pompano Beach, FL Phone Book
- West Palm Beach, FL Phone Book
- Miami Gardens, FL Phone Book
- Lakeland, FL Phone Book
- Davie, FL Phone Book
- Boca Raton, FL Phone Book
- Riverview, FL Phone Book
- Sunrise, FL Phone Book
- Plantation, FL Phone Book
- Deltona, FL Phone Book
- Miami Beach, FL Phone Book
- Palm Coast, FL Phone Book
- Largo, FL Phone Book
- Fort Myers, FL Phone Book
- Melbourne, FL Phone Book
- Deerfield Beach, FL Phone Book
- Boynton Beach, FL Phone Book
- Kissimmee, FL Phone Book
- Lauderhill, FL Phone Book
- Weston, FL Phone Book
- Homestead, FL Phone Book
- Delray Beach, FL Phone Book
- North Port, FL Phone Book
- Daytona Beach, FL Phone Book
- Tamarac, FL Phone Book
- Jupiter, FL Phone Book
- Wellington, FL Phone Book
- Port Charlotte, FL Phone Book
- Port Orange, FL Phone Book
- North Miami, FL Phone Book
- Doral, FL Phone Book
- Palm Harbor, FL Phone Book
- Coconut Creek, FL Phone Book
- Wesley Chapel, FL Phone Book
- Sanford, FL Phone Book
- Ocala, FL Phone Book
- Margate, FL Phone Book
- Sarasota, FL Phone Book
- Bonita Springs, FL Phone Book
- Bradenton, FL Phone Book
- Palm Beach Gardens, FL Phone Book
- Pinellas Park, FL Phone Book
- St. Cloud, FL Phone Book
- Pensacola, FL Phone Book
- Apopka, FL Phone Book
- Coral Gables, FL Phone Book
- Ocoee, FL Phone Book
- Titusville, FL Phone Book
- Fort Pierce, FL Phone Book
- Oakland Park, FL Phone Book
- Winter Garden, FL Phone Book
- North Lauderdale, FL Phone Book
- Altamonte Springs, FL Phone Book
- Cutler Bay, FL Phone Book
- Ormond Beach, FL Phone Book
- Winter Haven, FL Phone Book
- North Miami Beach, FL Phone Book
- North Fort Myers, FL Phone Book
- Greenacres, FL Phone Book
- Oviedo, FL Phone Book
- Valrico, FL Phone Book
- Hallandale Beach, FL Phone Book
- Royal Palm Beach, FL Phone Book
- Plant City, FL Phone Book
- Land O' Lakes, FL Phone Book
- Navarre, FL Phone Book
- Aventura, FL Phone Book
- Winter Springs, FL Phone Book
- Clermont, FL Phone Book
- Dunedin, FL Phone Book
- Lauderdale Lakes, FL Phone Book
- Panama City, FL Phone Book
- Riviera Beach, FL Phone Book
- Merritt Island, FL Phone Book
- DeLand, FL Phone Book
- Estero, FL Phone Book
- Dania Beach, FL Phone Book
- Miami Lakes, FL Phone Book
- Winter Park, FL Phone Book
- Casselberry, FL Phone Book
- Immokalee, FL Phone Book
- Rockledge, FL Phone Book
- New Smyrna Beach, FL Phone Book
- Temple Terrace, FL Phone Book
- Ruskin, FL Phone Book
- Sebastian, FL Phone Book
- Tarpon Springs, FL Phone Book
- Haines City, FL Phone Book
- Crestview, FL Phone Book
- Key West, FL Phone Book
- Venice, FL Phone Book
- Jacksonville Beach, FL Phone Book
- Hialeah Gardens, FL Phone Book
- West Melbourne, FL Phone Book
- Leesburg, FL Phone Book
- Lutz, FL Phone Book
- Fort Walton Beach, FL Phone Book
- Sunny Isles Beach, FL Phone Book
- Naples, FL Phone Book
- Eustis, FL Phone Book
- Holiday, FL Phone Book
- Cocoa, FL Phone Book
- Punta Gorda, FL Phone Book
- Belle Glade, FL Phone Book
- Bartow, FL Phone Book
- Englewood, FL Phone Book
- Seminole, FL Phone Book
- Marco Island, FL Phone Book
- Maitland, FL Phone Book
- Lake Butler, FL Phone Book
- Tavares, FL Phone Book
- Vero Beach, FL Phone Book
- Lake Mary, FL Phone Book
- New Port Richey, FL Phone Book
- Lake Wales, FL Phone Book
- Stuart, FL Phone Book
- Auburndale, FL Phone Book
- Zephyrhills, FL Phone Book
- Lady Lake, FL Phone Book
- Niceville, FL Phone Book
- Longwood, FL Phone Book
- St. Augustine, FL Phone Book
- Oldsmar, FL Phone Book
- Hobe Sound, FL Phone Book
- Destin, FL Phone Book
- Mount Dora, FL Phone Book
- Miami Springs, FL Phone Book
- Atlantic Beach, FL Phone Book
- Palmetto, FL Phone Book
- Jensen Beach, FL Phone Book
- Yulee, FL Phone Book
- Key Biscayne, FL Phone Book
- Panama City Beach, FL Phone Book
- Fernandina Beach, FL Phone Book
- Wilton Manors, FL Phone Book
- Middleburg, FL Phone Book
- Holly Hill, FL Phone Book
- Orange City, FL Phone Book
- Lake City, FL Phone Book
- Lantana, FL Phone Book
- South Miami, FL Phone Book
- Florida City, FL Phone Book
- Cocoa Beach, FL Phone Book
- Hudson, FL Phone Book
- Celebration, FL Phone Book
- Satellite Beach, FL Phone Book
- Avon Park, FL Phone Book
- Sebring, FL Phone Book
- Cape Canaveral, FL Phone Book
- Palatka, FL Phone Book
- Milton, FL Phone Book
- Alachua, FL Phone Book
- Key Largo, FL Phone Book
- St. Pete Beach, FL Phone Book
- Miramar Beach, FL Phone Book
- Palm Beach, FL Phone Book
- Orange Park, FL Phone Book
- Marathon, FL Phone Book
- Brooksville, FL Phone Book
- Green Cove Springs, FL Phone Book
- Seffner, FL Phone Book
- Arcadia, FL Phone Book
- Clewiston, FL Phone Book
- Inverness, FL Phone Book
- Sanibel, FL Phone Book
- Wildwood, FL Phone Book
- Dade City, FL Phone Book
- Quincy, FL Phone Book
- Lecanto, FL Phone Book
- Fort Myers Beach, FL Phone Book
- Live Oak, FL Phone Book
- Perry, FL Phone Book
- Macclenny, FL Phone Book
- Gulf Breeze, FL Phone Book
- DeFuniak Springs, FL Phone Book
- Marianna, FL Phone Book
- High Springs, FL Phone Book
- Okeechobee, FL Phone Book
- Davenport, FL Phone Book
- Starke, FL Phone Book
- LaBelle, FL Phone Book
- Plantation, FL Phone Book
- Wauchula, FL Phone Book
- Daytona Beach Shores, FL Phone Book
- Jasper, FL Phone Book
- Mulberry, FL Phone Book
- Crawfordville, FL Phone Book
- Chipley, FL Phone Book
- Port St. Joe, FL Phone Book
- Blountstown, FL Phone Book
- Bushnell, FL Phone Book
- Crystal River, FL Phone Book
- Port Richey, FL Phone Book
- Bunnell, FL Phone Book
- Madison, FL Phone Book
- Bonifay, FL Phone Book
- Cross City, FL Phone Book
- Apalachicola, FL Phone Book
- Eastpoint, FL Phone Book
- Dunnellon, FL Phone Book
- Chiefland, FL Phone Book
- Lake Placid, FL Phone Book
- Moore Haven, FL Phone Book
- Monticello, FL Phone Book
- Mayo, FL Phone Book
- Lake Butler, FL Phone Book
- Bronson, FL Phone Book
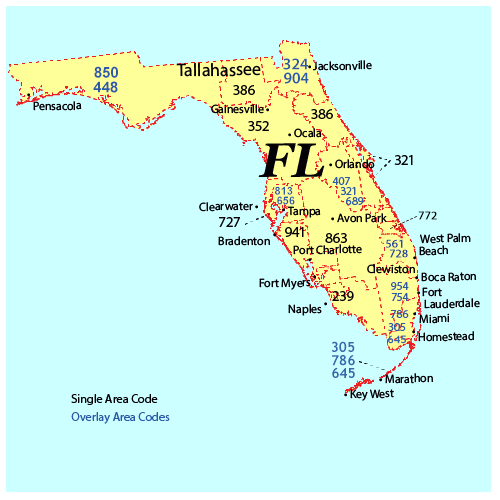
- Bristol, FL Phone Book
- Lake Buena Vista, FL Phone Book
- Lake Worth, FL Phone Book
- Parrish, FL Phone Book
- Dania, FL Phone Book
- Loxahatchee, FL Phone Book
- Clearwater Beach, FL Phone Book
- St. Johns, FL Phone Book
- Opa Locka, FL Phone Book
- Santa Rosa Beach, FL Phone Book
- Islamorada, FL Phone Book
- Ponte Vedra Beach, FL Phone Book
- Pensacola Beach, FL Phone Book
Local Time in Bristol, FL
Local Time
03:18 PM
Date
Tuesday, April 08, 2025
Time Zone
EDT
Bristol, FL Population
Chicago has a population of 1062 people. Sex ratio is 98.50 males per 100 females.
Population by Age
The median age in Chicago is 34.8 years.
| Age Groups | Population |
|---|---|
| Under 5 years | 35 |
| 5 to 9 years | 40 |
| 10 to 14 years | 77 |
| 15 to 19 years | 71 |
| 20 to 24 years | 36 |
| 25 to 29 years | 95 |
| 30 to 34 years | 26 |
| 35 to 39 years | 90 |
| 40 to 44 years | 38 |
| 45 to 49 years | 45 |
| 50 to 54 years | 34 |
| 55 to 59 years | 114 |
| 60 to 64 years | 74 |
| 65 to 69 years | 80 |
| 70 to 74 years | 44 |
| 75 to 79 years | 33 |
| 80 to 84 years | 90 |
| 85 years and over | 40 |
Race & Ethnicity
| Racial/Ethnic Groups | Percent |
|---|---|
| White | 727 |
| Black or African American | 73 |
| American Indian and Alaska Native | 7 |
| Native Hawaiian and Other Pacific Islander | 1 |
| Some Other Race | 67 |
| Two or more races | 37 |