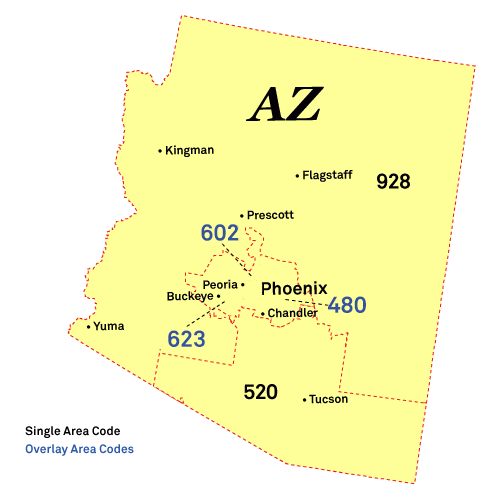
Snowflake Phone Book
Public Schools
Hotels and Motels
Alternative Fuel Stations
Local Education Agencies
Northern Arizona Vocational Institute Of Technolog (78786)
951 W Snowflake Blvd, Snowflake, AZ 85937
Snowflake Reverse Phone Lookup
Browse Chicago phone numbers by rate center and prefix.
Snowflake Phone Numbers
Rate Center: Snowflake (SNOWFLAKE)
Phone numbers with the Snowflake rate center prefixes:
Illinois City Phone Books
- Phoenix, AZ Phone Book
- Tucson, AZ Phone Book
- Mesa, AZ Phone Book
- Chandler, AZ Phone Book
- Scottsdale, AZ Phone Book
- Glendale, AZ Phone Book
- Gilbert, AZ Phone Book
- Tempe, AZ Phone Book
- Peoria, AZ Phone Book
- Surprise, AZ Phone Book
- San Tan Valley, AZ Phone Book
- Yuma, AZ Phone Book
- Avondale, AZ Phone Book
- Goodyear, AZ Phone Book
- Buckeye, AZ Phone Book
- Flagstaff, AZ Phone Book
- Casa Grande, AZ Phone Book
- Lake Havasu City, AZ Phone Book
- Queen Creek, AZ Phone Book
- Maricopa, AZ Phone Book
- Marana, AZ Phone Book
- Prescott Valley, AZ Phone Book
- Oro Valley, AZ Phone Book
- Sierra Vista, AZ Phone Book
- Prescott, AZ Phone Book
- Apache Junction, AZ Phone Book
- Bullhead City, AZ Phone Book
- El Mirage, AZ Phone Book
- San Luis, AZ Phone Book
- Sahuarita, AZ Phone Book
- Kingman, AZ Phone Book
- Florence, AZ Phone Book
- Fountain Hills, AZ Phone Book
- Anthem, AZ Phone Book
- Green Valley, AZ Phone Book
- Nogales, AZ Phone Book
- Rio Rico, AZ Phone Book
- Eloy, AZ Phone Book
- Somerton, AZ Phone Book
- Douglas, AZ Phone Book
- Fort Mohave, AZ Phone Book
- Payson, AZ Phone Book
- Vail, AZ Phone Book
- Coolidge, AZ Phone Book
- Cottonwood, AZ Phone Book
- Chino Valley, AZ Phone Book
- Show Low, AZ Phone Book
- Camp Verde, AZ Phone Book
- Sedona, AZ Phone Book
- Safford, AZ Phone Book
- Winslow, AZ Phone Book
- Tuba City, AZ Phone Book
- Wickenburg, AZ Phone Book
- Page, AZ Phone Book
- Globe, AZ Phone Book
- Tolleson, AZ Phone Book
- Litchfield Park, AZ Phone Book
- Snowflake, AZ Phone Book
- Kayenta, AZ Phone Book
- Bisbee, AZ Phone Book
- Thatcher, AZ Phone Book
- Holbrook, AZ Phone Book
- Colorado City, AZ Phone Book
- Benson, AZ Phone Book
- Chinle, AZ Phone Book
- Whiteriver, AZ Phone Book
- San Manuel, AZ Phone Book
- Willcox, AZ Phone Book
- Williams, AZ Phone Book
- Parker, AZ Phone Book
- Superior, AZ Phone Book
- Wellton, AZ Phone Book
- Mohave Valley, AZ Phone Book
- Ajo, AZ Phone Book
- Pima, AZ Phone Book
- Sells, AZ Phone Book
- Gila Bend, AZ Phone Book
- Miami, AZ Phone Book
- Mayer, AZ Phone Book
- Tombstone, AZ Phone Book
- Fredonia, AZ Phone Book
- Ganado, AZ Phone Book
- Patagonia, AZ Phone Book
- Seligman, AZ Phone Book
- Duncan, AZ Phone Book
- Elfrida, AZ Phone Book
- Cottonwood, AZ Phone Book
- Tonopah, AZ Phone Book
- Lakeside, AZ Phone Book
- Grand Canyon, AZ Phone Book
- Fort Huachuca, AZ Phone Book
- Laveen, AZ Phone Book
Local Time in Snowflake, AZ
Local Time
01:53 AM
Date
Saturday, April 26, 2025
Time Zone
MST
Snowflake, AZ Population
Chicago has a population of 5873 people. Sex ratio is 99.50 males per 100 females.
Population by Age
The median age in Chicago is 34.8 years.
| Age Groups | Population |
|---|---|
| Under 5 years | 265 |
| 5 to 9 years | 558 |
| 10 to 14 years | 920 |
| 15 to 19 years | 580 |
| 20 to 24 years | 366 |
| 25 to 29 years | 286 |
| 30 to 34 years | 375 |
| 35 to 39 years | 327 |
| 40 to 44 years | 342 |
| 45 to 49 years | 335 |
| 50 to 54 years | 253 |
| 55 to 59 years | 256 |
| 60 to 64 years | 283 |
| 65 to 69 years | 187 |
| 70 to 74 years | 296 |
| 75 to 79 years | 155 |
| 80 to 84 years | 35 |
| 85 years and over | 54 |
Race & Ethnicity
| Racial/Ethnic Groups | Percent |
|---|---|
| White | 5034 |
| Black or African American | 21 |
| American Indian and Alaska Native | 311 |
| Native Hawaiian and Other Pacific Islander | 19 |
| Some Other Race | 184 |
| Two or more races | 512 |
