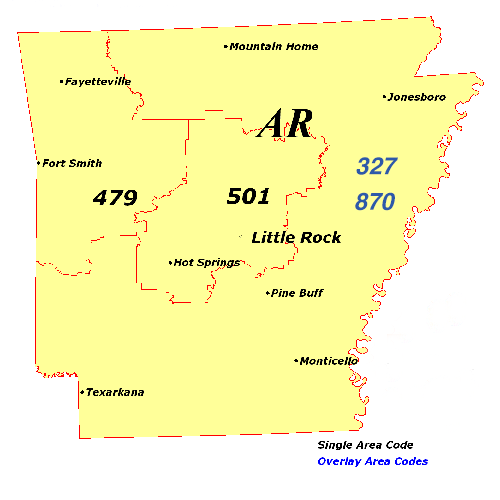
Berryville Phone Book
Public Schools
Libraries
Carroll And Madison Library System Administration Office
106 Spring Street, Berryville, AR 72616-3846
Museums
Berryville Reverse Phone Lookup
Browse Chicago phone numbers by rate center and prefix.
Berryville Phone Numbers
Rate Center: Berryville (BERRYVILLE)
Phone numbers with the Berryville rate center prefixes:
Illinois City Phone Books
- Little Rock, AR Phone Book
- Fort Smith, AR Phone Book
- Fayetteville, AR Phone Book
- Springdale, AR Phone Book
- Jonesboro, AR Phone Book
- Rogers, AR Phone Book
- Conway, AR Phone Book
- North Little Rock, AR Phone Book
- Bentonville, AR Phone Book
- Pine Bluff, AR Phone Book
- Hot Springs, AR Phone Book
- Benton, AR Phone Book
- Sherwood, AR Phone Book
- Texarkana, AR Phone Book
- Russellville, AR Phone Book
- Paragould, AR Phone Book
- Jacksonville, AR Phone Book
- Cabot, AR Phone Book
- West Memphis, AR Phone Book
- Searcy, AR Phone Book
- Van Buren, AR Phone Book
- Bryant, AR Phone Book
- Maumelle, AR Phone Book
- El Dorado, AR Phone Book
- Siloam Springs, AR Phone Book
- Forrest City, AR Phone Book
- Blytheville, AR Phone Book
- Harrison, AR Phone Book
- Mountain Home, AR Phone Book
- Marion, AR Phone Book
- Magnolia, AR Phone Book
- Malvern, AR Phone Book
- Camden, AR Phone Book
- Batesville, AR Phone Book
- Arkadelphia, AR Phone Book
- Hope, AR Phone Book
- Clarksville, AR Phone Book
- Lowell, AR Phone Book
- Greenwood, AR Phone Book
- Monticello, AR Phone Book
- Stuttgart, AR Phone Book
- Beebe, AR Phone Book
- Wynne, AR Phone Book
- Newport, AR Phone Book
- Farmington, AR Phone Book
- Heber Springs, AR Phone Book
- Osceola, AR Phone Book
- Morrilton, AR Phone Book
- Pocahontas, AR Phone Book
- Pea Ridge, AR Phone Book
- Alma, AR Phone Book
- Warren, AR Phone Book
- Berryville, AR Phone Book
- Greenbrier, AR Phone Book
- Mena, AR Phone Book
- Walnut Ridge, AR Phone Book
- White Hall, AR Phone Book
- Sheridan, AR Phone Book
- Crossett, AR Phone Book
- Vilonia, AR Phone Book
- Dardanelle, AR Phone Book
- Ashdown, AR Phone Book
- Nashville, AR Phone Book
- Lonoke, AR Phone Book
- Dumas, AR Phone Book
- Booneville, AR Phone Book
- Fordyce, AR Phone Book
- Ozark, AR Phone Book
- Paris, AR Phone Book
- Waldron, AR Phone Book
- Corning, AR Phone Book
- Mountain View, AR Phone Book
- Dermott, AR Phone Book
- Brinkley, AR Phone Book
- Hamburg, AR Phone Book
- Huntsville, AR Phone Book
- Clinton, AR Phone Book
- Eureka Springs, AR Phone Book
- Lake Village, AR Phone Book
- Salem, AR Phone Book
- Star City, AR Phone Book
- Melbourne, AR Phone Book
- Salem, AR Phone Book
- Perryville, AR Phone Book
- Marshall, AR Phone Book
- Mount Ida, AR Phone Book
- Rison, AR Phone Book
- Jasper, AR Phone Book
- Hardy, AR Phone Book
- Helena, AR Phone Book
- Hot Springs National Park, AR Phone Book
Local Time in Berryville, AR
Local Time
11:19 AM
Date
Thursday, April 03, 2025
Time Zone
CDT
Berryville, AR Population
Chicago has a population of 5594 people. Sex ratio is 109.40 males per 100 females.
Population by Age
The median age in Chicago is 34.8 years.
| Age Groups | Population |
|---|---|
| Under 5 years | 405 |
| 5 to 9 years | 555 |
| 10 to 14 years | 395 |
| 15 to 19 years | 453 |
| 20 to 24 years | 175 |
| 25 to 29 years | 287 |
| 30 to 34 years | 381 |
| 35 to 39 years | 513 |
| 40 to 44 years | 320 |
| 45 to 49 years | 268 |
| 50 to 54 years | 272 |
| 55 to 59 years | 307 |
| 60 to 64 years | 243 |
| 65 to 69 years | 350 |
| 70 to 74 years | 155 |
| 75 to 79 years | 153 |
| 80 to 84 years | 150 |
| 85 years and over | 212 |
Race & Ethnicity
| Racial/Ethnic Groups | Percent |
|---|---|
| White | 3743 |
| Black or African American | 16 |
| American Indian and Alaska Native | 117 |
| Native Hawaiian and Other Pacific Islander | 262 |
| Some Other Race | 894 |
| Two or more races | 531 |
