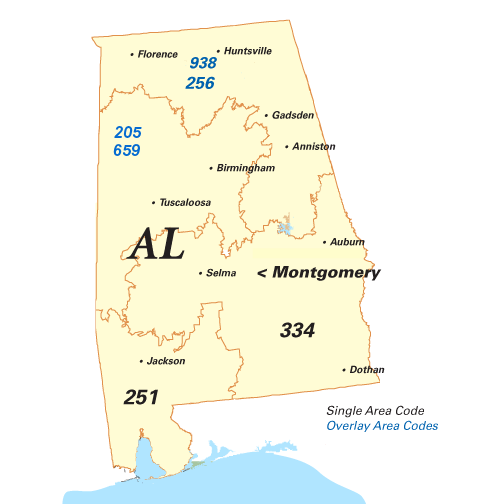
Bay Minette Phone Book
Public Schools
North Baldwin Center For Technology
505 Dr Martin Luther King Blvd, Bay Minette, AL 36507
Hotels and Motels
Health Centers
Fire Departments
Bay Minette Reverse Phone Lookup
Browse Chicago phone numbers by rate center and prefix.
Bay Minette Phone Numbers
Rate Center: Bay Minette (BAYMINETTE)
Phone numbers with the Bay Minette rate center prefixes:
Illinois City Phone Books
- Birmingham, AL Phone Book
- Huntsville, AL Phone Book
- Montgomery, AL Phone Book
- Mobile, AL Phone Book
- Tuscaloosa, AL Phone Book
- Hoover, AL Phone Book
- Dothan, AL Phone Book
- Auburn, AL Phone Book
- Decatur, AL Phone Book
- Madison, AL Phone Book
- Florence, AL Phone Book
- Prattville, AL Phone Book
- Phenix City, AL Phone Book
- Gadsden, AL Phone Book
- Vestavia Hills, AL Phone Book
- Alabaster, AL Phone Book
- Opelika, AL Phone Book
- Enterprise, AL Phone Book
- Athens, AL Phone Book
- Daphne, AL Phone Book
- Bessemer, AL Phone Book
- Northport, AL Phone Book
- Homewood, AL Phone Book
- Pelham, AL Phone Book
- Trussville, AL Phone Book
- Fairhope, AL Phone Book
- Albertville, AL Phone Book
- Anniston, AL Phone Book
- Oxford, AL Phone Book
- Foley, AL Phone Book
- Troy, AL Phone Book
- Selma, AL Phone Book
- Cullman, AL Phone Book
- Millbrook, AL Phone Book
- Talladega, AL Phone Book
- Saraland, AL Phone Book
- Alexander City, AL Phone Book
- Scottsboro, AL Phone Book
- Hartselle, AL Phone Book
- Muscle Shoals, AL Phone Book
- Ozark, AL Phone Book
- Calera, AL Phone Book
- Pell City, AL Phone Book
- Fort Payne, AL Phone Book
- Gardendale, AL Phone Book
- Jasper, AL Phone Book
- Jacksonville, AL Phone Book
- Leeds, AL Phone Book
- Gulf Shores, AL Phone Book
- Sylacauga, AL Phone Book
- Eufaula, AL Phone Book
- Fairfield, AL Phone Book
- Russellville, AL Phone Book
- Boaz, AL Phone Book
- Bay Minette, AL Phone Book
- Atmore, AL Phone Book
- Fultondale, AL Phone Book
- Valley, AL Phone Book
- Spanish Fort, AL Phone Book
- Sheffield, AL Phone Book
- Clanton, AL Phone Book
- Andalusia, AL Phone Book
- Guntersville, AL Phone Book
- Tuscumbia, AL Phone Book
- Tuskegee, AL Phone Book
- Arab, AL Phone Book
- Wetumpka, AL Phone Book
- Greenville, AL Phone Book
- Montevallo, AL Phone Book
- Robertsdale, AL Phone Book
- Demopolis, AL Phone Book
- Hamilton, AL Phone Book
- Oneonta, AL Phone Book
- Opp, AL Phone Book
- Lanett, AL Phone Book
- Orange Beach, AL Phone Book
- Roanoke, AL Phone Book
- Attalla, AL Phone Book
- Monroeville, AL Phone Book
- Fort Rucker, AL Phone Book
- Brewton, AL Phone Book
- Jackson, AL Phone Book
- Columbiana, AL Phone Book
- Piedmont, AL Phone Book
- Springville, AL Phone Book
- Fayette, AL Phone Book
- Geneva, AL Phone Book
- Haleyville, AL Phone Book
- Thomasville, AL Phone Book
- Evergreen, AL Phone Book
- Centre, AL Phone Book
- Union Springs, AL Phone Book
- Heflin, AL Phone Book
- Hanceville, AL Phone Book
- Livingston, AL Phone Book
- Moulton, AL Phone Book
- Marion, AL Phone Book
- Dadeville, AL Phone Book
- Greensboro, AL Phone Book
- Eutaw, AL Phone Book
- Centreville, AL Phone Book
- Ashville, AL Phone Book
- Camden, AL Phone Book
- Grove Hill, AL Phone Book
- Chatom, AL Phone Book
- Wedowee, AL Phone Book
- Lafayette, AL Phone Book
- Hope Hull, AL Phone Book
- Irvington, AL Phone Book
Local Time in Bay Minette, AL
Local Time
09:03 AM
Date
Sunday, April 27, 2025
Time Zone
CDT
Bay Minette, AL Population
Chicago has a population of 9297 people. Sex ratio is 96.60 males per 100 females.
Population by Age
The median age in Chicago is 34.8 years.
| Age Groups | Population |
|---|---|
| Under 5 years | 506 |
| 5 to 9 years | 577 |
| 10 to 14 years | 688 |
| 15 to 19 years | 937 |
| 20 to 24 years | 646 |
| 25 to 29 years | 889 |
| 30 to 34 years | 593 |
| 35 to 39 years | 531 |
| 40 to 44 years | 460 |
| 45 to 49 years | 454 |
| 50 to 54 years | 470 |
| 55 to 59 years | 414 |
| 60 to 64 years | 675 |
| 65 to 69 years | 503 |
| 70 to 74 years | 364 |
| 75 to 79 years | 238 |
| 80 to 84 years | 191 |
| 85 years and over | 161 |
Race & Ethnicity
| Racial/Ethnic Groups | Percent |
|---|---|
| White | 4590 |
| Black or African American | 2871 |
| American Indian and Alaska Native | 98 |
| Native Hawaiian and Other Pacific Islander | 2 |
| Some Other Race | 87 |
| Two or more races | 414 |
