Fitchburg Phone Book
Public Schools
Alternative Fuel Stations
Fire Departments
Fitchburg Reverse Phone Lookup
Browse Chicago phone numbers by rate center and prefix.
Fitchburg Phone Numbers
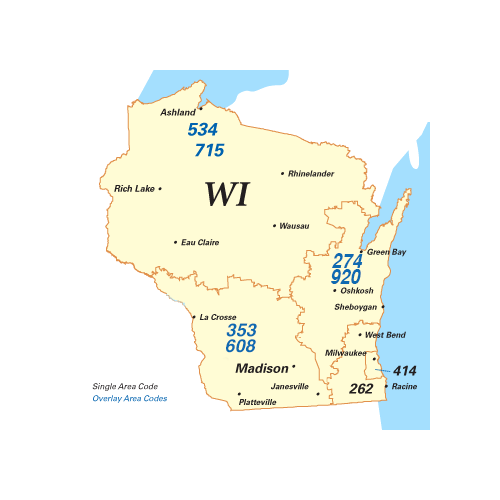
Rate Center: Madison (MADISON)
Phone numbers with the Madison rate center prefixes:
- Phone Numbers 608-204-....
- Phone Numbers 608-206-....
- Phone Numbers 608-209-....
- Phone Numbers 608-212-....
- Phone Numbers 608-213-....
- Phone Numbers 608-215-....
- Phone Numbers 608-216-....
- Phone Numbers 608-217-....
- Phone Numbers 608-218-....
- Phone Numbers 608-219-....
- Phone Numbers 608-220-....
- Phone Numbers 608-221-....
- Phone Numbers 608-222-....
- Phone Numbers 608-223-....
- Phone Numbers 608-224-....
- Phone Numbers 608-225-....
- Phone Numbers 608-226-....
- Phone Numbers 608-227-....
- Phone Numbers 608-228-....
- Phone Numbers 608-229-....
- Phone Numbers 608-230-....
- Phone Numbers 608-231-....
- Phone Numbers 608-232-....
- Phone Numbers 608-233-....
- Phone Numbers 608-234-....
- Phone Numbers 608-235-....
- Phone Numbers 608-236-....
- Phone Numbers 608-237-....
- Phone Numbers 608-238-....
- Phone Numbers 608-239-....
- Phone Numbers 608-240-....
- Phone Numbers 608-241-....
- Phone Numbers 608-242-....
- Phone Numbers 608-243-....
- Phone Numbers 608-244-....
- Phone Numbers 608-246-....
- Phone Numbers 608-249-....
- Phone Numbers 608-250-....
- Phone Numbers 608-251-....
- Phone Numbers 608-252-....
- Phone Numbers 608-255-....
- Phone Numbers 608-256-....
- Phone Numbers 608-257-....
- Phone Numbers 608-258-....
- Phone Numbers 608-259-....
- Phone Numbers 608-260-....
- Phone Numbers 608-261-....
- Phone Numbers 608-262-....
- Phone Numbers 608-263-....
- Phone Numbers 608-264-....
- Phone Numbers 608-265-....
- Phone Numbers 608-266-....
- Phone Numbers 608-267-....
- Phone Numbers 608-268-....
- Phone Numbers 608-270-....
- Phone Numbers 608-271-....
- Phone Numbers 608-273-....
- Phone Numbers 608-274-....
- Phone Numbers 608-275-....
- Phone Numbers 608-276-....
- Phone Numbers 608-277-....
- Phone Numbers 608-278-....
- Phone Numbers 608-279-....
- Phone Numbers 608-280-....
- Phone Numbers 608-282-....
- Phone Numbers 608-283-....
- Phone Numbers 608-284-....
- Phone Numbers 608-285-....
- Phone Numbers 608-286-....
- Phone Numbers 608-287-....
- Phone Numbers 608-288-....
- Phone Numbers 608-294-....
- Phone Numbers 608-298-....
- Phone Numbers 608-308-....
- Phone Numbers 608-310-....
- Phone Numbers 608-316-....
- Phone Numbers 608-320-....
- Phone Numbers 608-327-....
- Phone Numbers 608-332-....
- Phone Numbers 608-333-....
- Phone Numbers 608-334-....
- Phone Numbers 608-335-....
- Phone Numbers 608-338-....
- Phone Numbers 608-345-....
- Phone Numbers 608-347-....
- Phone Numbers 608-354-....
- Phone Numbers 608-358-....
- Phone Numbers 608-381-....
- Phone Numbers 608-395-....
- Phone Numbers 608-398-....
- Phone Numbers 608-405-....
- Phone Numbers 608-416-....
- Phone Numbers 608-417-....
- Phone Numbers 608-421-....
- Phone Numbers 608-440-....
- Phone Numbers 608-441-....
- Phone Numbers 608-442-....
- Phone Numbers 608-443-....
- Phone Numbers 608-444-....
- Phone Numbers 608-445-....
- Phone Numbers 608-446-....
- Phone Numbers 608-458-....
- Phone Numbers 608-467-....
- Phone Numbers 608-469-....
- Phone Numbers 608-471-....
- Phone Numbers 608-504-....
- Phone Numbers 608-509-....
- Phone Numbers 608-512-....
- Phone Numbers 608-513-....
- Phone Numbers 608-514-....
- Phone Numbers 608-515-....
- Phone Numbers 608-516-....
- Phone Numbers 608-520-....
- Phone Numbers 608-535-....
- Phone Numbers 608-556-....
- Phone Numbers 608-572-....
- Phone Numbers 608-575-....
- Phone Numbers 608-576-....
- Phone Numbers 608-577-....
- Phone Numbers 608-598-....
- Phone Numbers 608-609-....
- Phone Numbers 608-616-....
- Phone Numbers 608-620-....
- Phone Numbers 608-628-....
- Phone Numbers 608-630-....
- Phone Numbers 608-658-....
- Phone Numbers 608-661-....
- Phone Numbers 608-663-....
- Phone Numbers 608-665-....
- Phone Numbers 608-669-....
- Phone Numbers 608-692-....
- Phone Numbers 608-695-....
- Phone Numbers 608-698-....
- Phone Numbers 608-709-....
- Phone Numbers 608-712-....
- Phone Numbers 608-720-....
- Phone Numbers 608-721-....
- Phone Numbers 608-729-....
- Phone Numbers 608-733-....
- Phone Numbers 608-770-....
- Phone Numbers 608-772-....
- Phone Numbers 608-807-....
- Phone Numbers 608-819-....
- Phone Numbers 608-843-....
- Phone Numbers 608-852-....
- Phone Numbers 608-886-....
- Phone Numbers 608-890-....
- Phone Numbers 608-957-....
- Phone Numbers 608-977-....
Illinois City Phone Books
- Milwaukee, WI Phone Book
- Madison, WI Phone Book
- Green Bay, WI Phone Book
- Kenosha, WI Phone Book
- Racine, WI Phone Book
- Appleton, WI Phone Book
- Waukesha, WI Phone Book
- Eau Claire, WI Phone Book
- Oshkosh, WI Phone Book
- Janesville, WI Phone Book
- West Allis, WI Phone Book
- La Crosse, WI Phone Book
- Sheboygan, WI Phone Book
- Wauwatosa, WI Phone Book
- Fond du Lac, WI Phone Book
- New Berlin, WI Phone Book
- Wausau, WI Phone Book
- Brookfield, WI Phone Book
- Menomonee Falls, WI Phone Book
- Greenfield, WI Phone Book
- Beloit, WI Phone Book
- Oak Creek, WI Phone Book
- Franklin, WI Phone Book
- Sun Prairie, WI Phone Book
- Manitowoc, WI Phone Book
- West Bend, WI Phone Book
- Fitchburg, WI Phone Book
- Mount Pleasant, WI Phone Book
- Superior, WI Phone Book
- Stevens Point, WI Phone Book
- Neenah, WI Phone Book
- Muskego, WI Phone Book
- De Pere, WI Phone Book
- Mequon, WI Phone Book
- Watertown, WI Phone Book
- Pleasant Prairie, WI Phone Book
- South Milwaukee, WI Phone Book
- Germantown, WI Phone Book
- Middleton, WI Phone Book
- Onalaska, WI Phone Book
- Menasha, WI Phone Book
- Marshfield, WI Phone Book
- Cudahy, WI Phone Book
- Wisconsin Rapids, WI Phone Book
- Oconomowoc, WI Phone Book
- Menomonie, WI Phone Book
- Beaver Dam, WI Phone Book
- Kaukauna, WI Phone Book
- River Falls, WI Phone Book
- Hartford, WI Phone Book
- Weston, WI Phone Book
- Whitewater, WI Phone Book
- Pewaukee, WI Phone Book
- Chippewa Falls, WI Phone Book
- Greendale, WI Phone Book
- Hudson, WI Phone Book
- Waunakee, WI Phone Book
- Verona, WI Phone Book
- Stoughton, WI Phone Book
- Plover, WI Phone Book
- Glendale, WI Phone Book
- Fort Atkinson, WI Phone Book
- Baraboo, WI Phone Book
- Platteville, WI Phone Book
- Port Washington, WI Phone Book
- Grafton, WI Phone Book
- Little Chute, WI Phone Book
- Cedarburg, WI Phone Book
- Waupun, WI Phone Book
- Two Rivers, WI Phone Book
- Burlington, WI Phone Book
- Sussex, WI Phone Book
- Monroe, WI Phone Book
- Marinette, WI Phone Book
- Oregon, WI Phone Book
- Portage, WI Phone Book
- Elkhorn, WI Phone Book
- Holmen, WI Phone Book
- Sparta, WI Phone Book
- Reedsburg, WI Phone Book
- Tomah, WI Phone Book
- Hartland, WI Phone Book
- New Richmond, WI Phone Book
- Merrill, WI Phone Book
- Shawano, WI Phone Book
- Sturgeon Bay, WI Phone Book
- McFarland, WI Phone Book
- Plymouth, WI Phone Book
- Rice Lake, WI Phone Book
- Delavan, WI Phone Book
- Mukwonago, WI Phone Book
- Monona, WI Phone Book
- Pewaukee, WI Phone Book
- Jefferson, WI Phone Book
- Sheboygan Falls, WI Phone Book
- Lake Geneva, WI Phone Book
- Ashland, WI Phone Book
- Ripon, WI Phone Book
- Antigo, WI Phone Book
- Altoona, WI Phone Book
- Rhinelander, WI Phone Book
- Delafield, WI Phone Book
- Mount Horeb, WI Phone Book
- New London, WI Phone Book
- Cottage Grove, WI Phone Book
- Kimberly, WI Phone Book
- Sturtevant, WI Phone Book
- Lake Mills, WI Phone Book
- Waupaca, WI Phone Book
- Prairie du Chien, WI Phone Book
- Edgerton, WI Phone Book
- Milton, WI Phone Book
- Waterford, WI Phone Book
- Evansville, WI Phone Book
- Rothschild, WI Phone Book
- Columbus, WI Phone Book
- Union Grove, WI Phone Book
- West Salem, WI Phone Book
- Richland Center, WI Phone Book
- Mayville, WI Phone Book
- Dodgeville, WI Phone Book
- Oconto, WI Phone Book
- Viroqua, WI Phone Book
- Prairie du Sac, WI Phone Book
- Mauston, WI Phone Book
- East Troy, WI Phone Book
- Medford, WI Phone Book
- Mosinee, WI Phone Book
- Baldwin, WI Phone Book
- Chilton, WI Phone Book
- Lancaster, WI Phone Book
- Stanley, WI Phone Book
- Kiel, WI Phone Book
- Black River Falls, WI Phone Book
- Seymour, WI Phone Book
- Barron, WI Phone Book
- Tomahawk, WI Phone Book
- Boscobel, WI Phone Book
- Ladysmith, WI Phone Book
- Lodi, WI Phone Book
- Wisconsin Dells, WI Phone Book
- Kewaunee, WI Phone Book
- Hortonville, WI Phone Book
- Amery, WI Phone Book
- Mineral Point, WI Phone Book
- Spooner, WI Phone Book
- Osceola, WI Phone Book
- Nekoosa, WI Phone Book
- Fennimore, WI Phone Book
- Hayward, WI Phone Book
- Cumberland, WI Phone Book
- Westby, WI Phone Book
- Darlington, WI Phone Book
- Neillsville, WI Phone Book
- Park Falls, WI Phone Book
- Wautoma, WI Phone Book
- Osseo, WI Phone Book
- Cameron, WI Phone Book
- Washburn, WI Phone Book
- Durand, WI Phone Book
- Phillips, WI Phone Book
- Eagle River, WI Phone Book
- Hurley, WI Phone Book
- Seymour, WI Phone Book
- Grantsburg, WI Phone Book
- Gillett, WI Phone Book
- Westfield, WI Phone Book
- Crivitz, WI Phone Book
- Cashton, WI Phone Book
- La Farge, WI Phone Book
- Turtle Lake, WI Phone Book
- Superior, WI Phone Book
- Bayfield, WI Phone Book
- Birchwood, WI Phone Book
- Minocqua, WI Phone Book
- Turtle Lake, WI Phone Book
Fitchburg, WI Population
Chicago has a population of 30032 people. Sex ratio is 113.30 males per 100 females.
Population by Age
The median age in Chicago is 34.8 years.
| Age Groups | Population |
|---|---|
| Under 5 years | 2230 |
| 5 to 9 years | 1918 |
| 10 to 14 years | 1592 |
| 15 to 19 years | 1087 |
| 20 to 24 years | 2335 |
| 25 to 29 years | 3360 |
| 30 to 34 years | 2942 |
| 35 to 39 years | 2449 |
| 40 to 44 years | 1637 |
| 45 to 49 years | 1479 |
| 50 to 54 years | 1389 |
| 55 to 59 years | 1899 |
| 60 to 64 years | 1842 |
| 65 to 69 years | 1556 |
| 70 to 74 years | 785 |
| 75 to 79 years | 776 |
| 80 to 84 years | 461 |
| 85 years and over | 295 |
Race & Ethnicity
| Racial/Ethnic Groups | Percent |
|---|---|
| White | 19349 |
| Black or African American | 3216 |
| American Indian and Alaska Native | 227 |
| Native Hawaiian and Other Pacific Islander | 12 |
| Some Other Race | 2527 |
| Two or more races | 2802 |